 13
13peptides
spectra
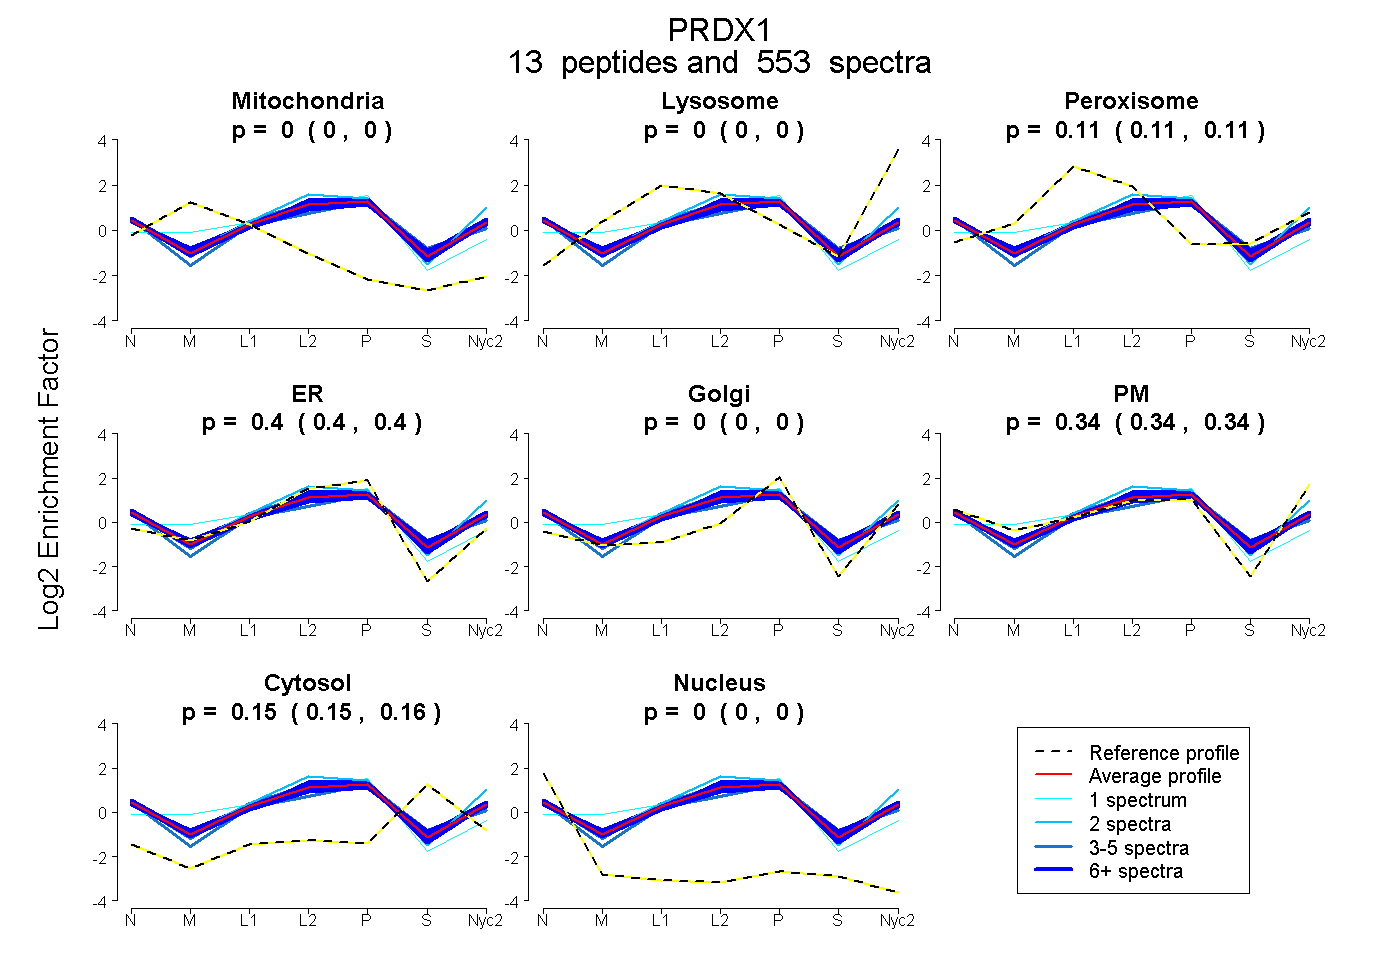
0.000 | 0.000
0.000 | 0.000
0.110 | 0.111
0.397 | 0.399
0.000 | 0.000
0.336 | 0.338
0.154 | 0.155
0.000 | 0.000
10peptides
spectra
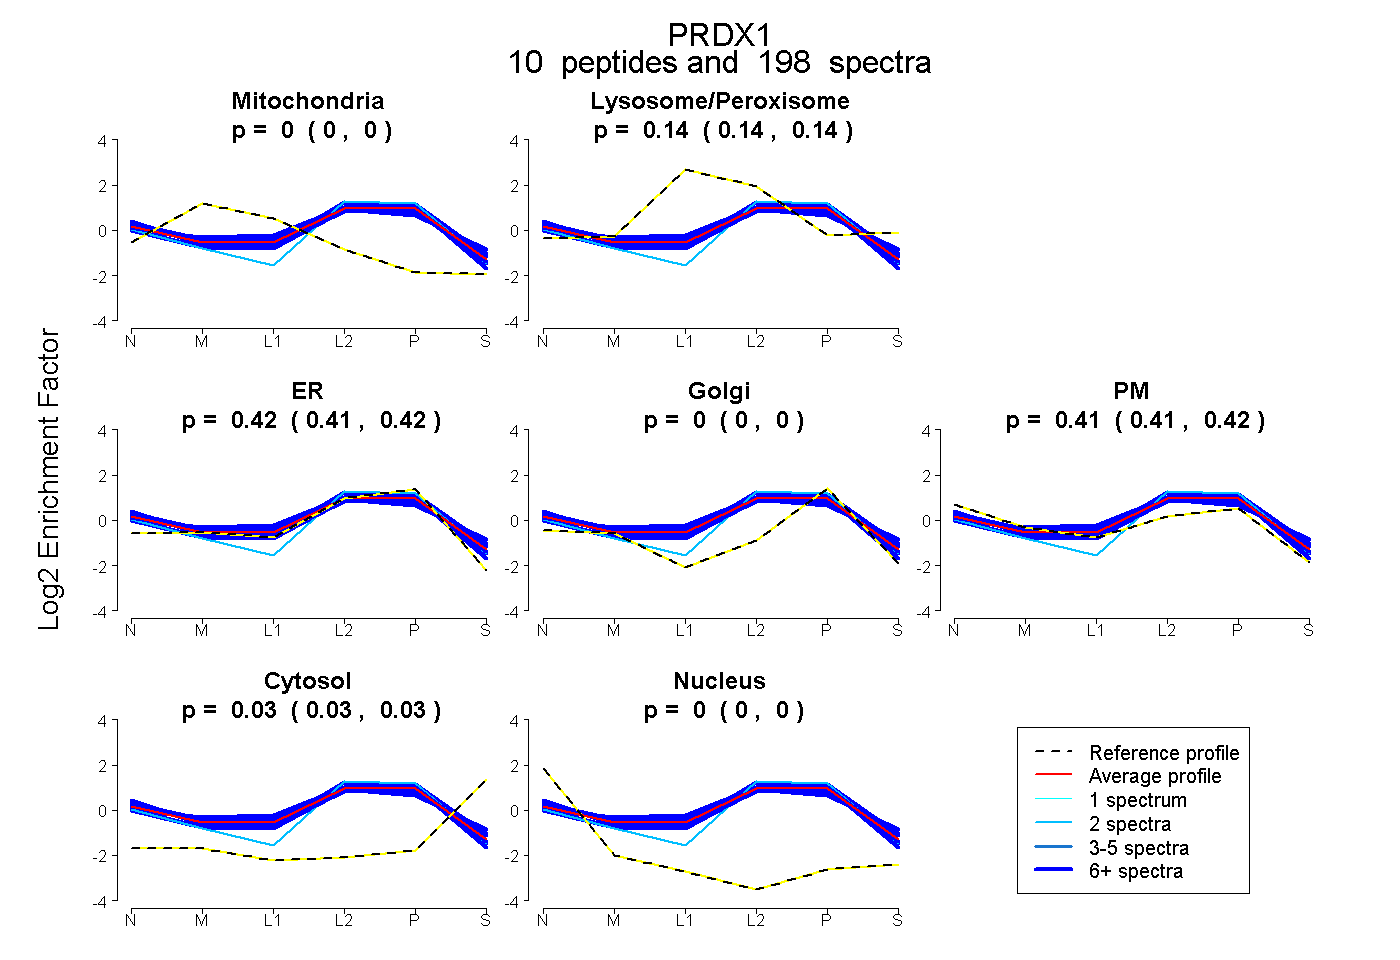
0.000 | 0.000
0.139 | 0.145
0.413 | 0.421
0.000 | 0.000
0.409 | 0.417
0.026 | 0.029
0.000 | 0.000
12peptides
spectra
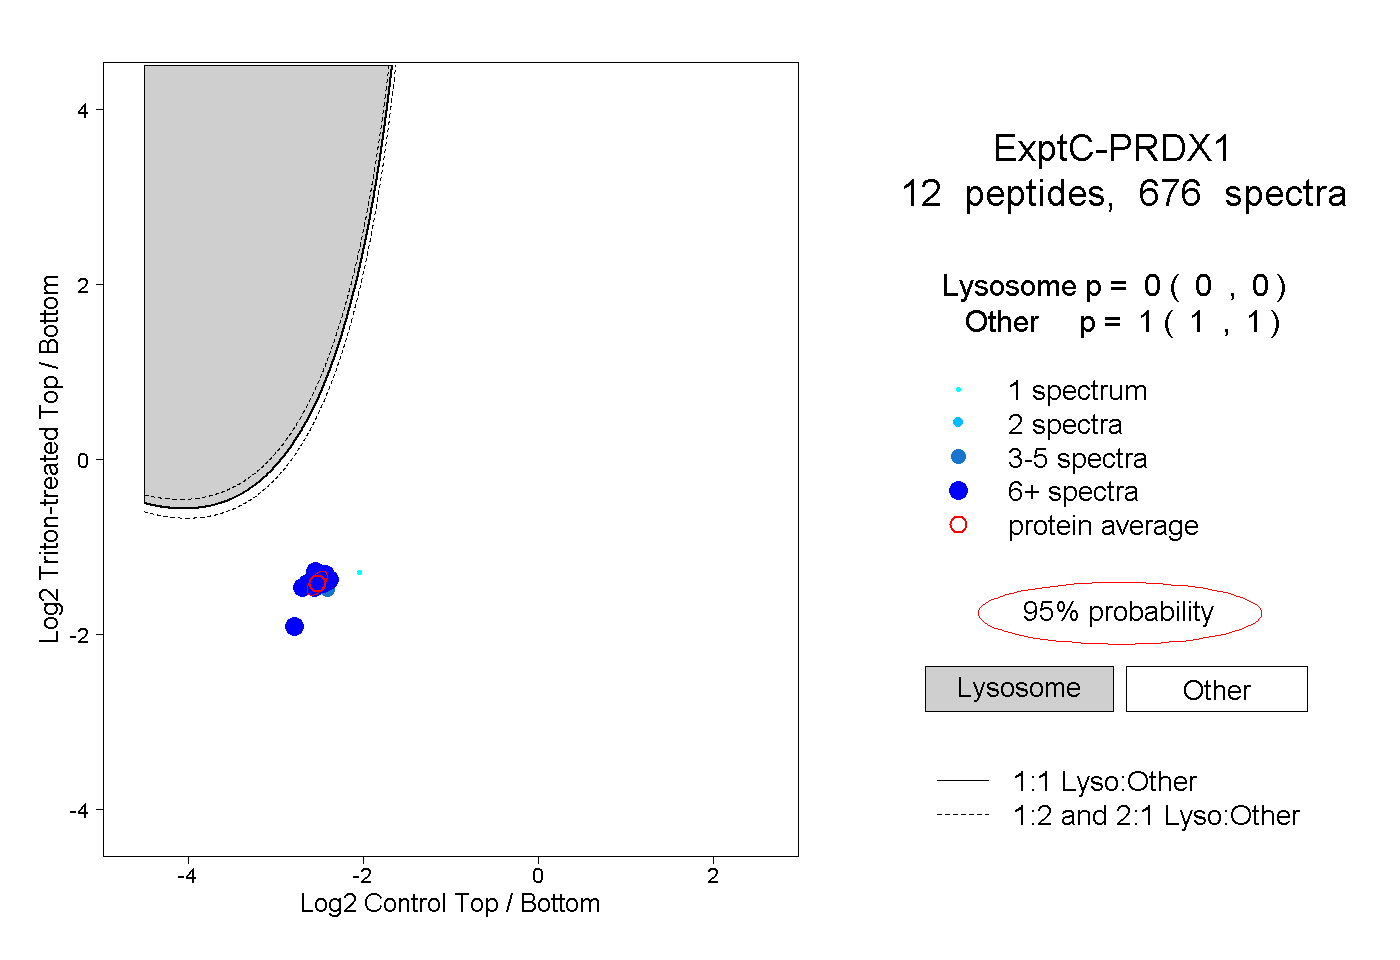
0.000 | 0.000
1.000 | 1.000
10peptides
spectra
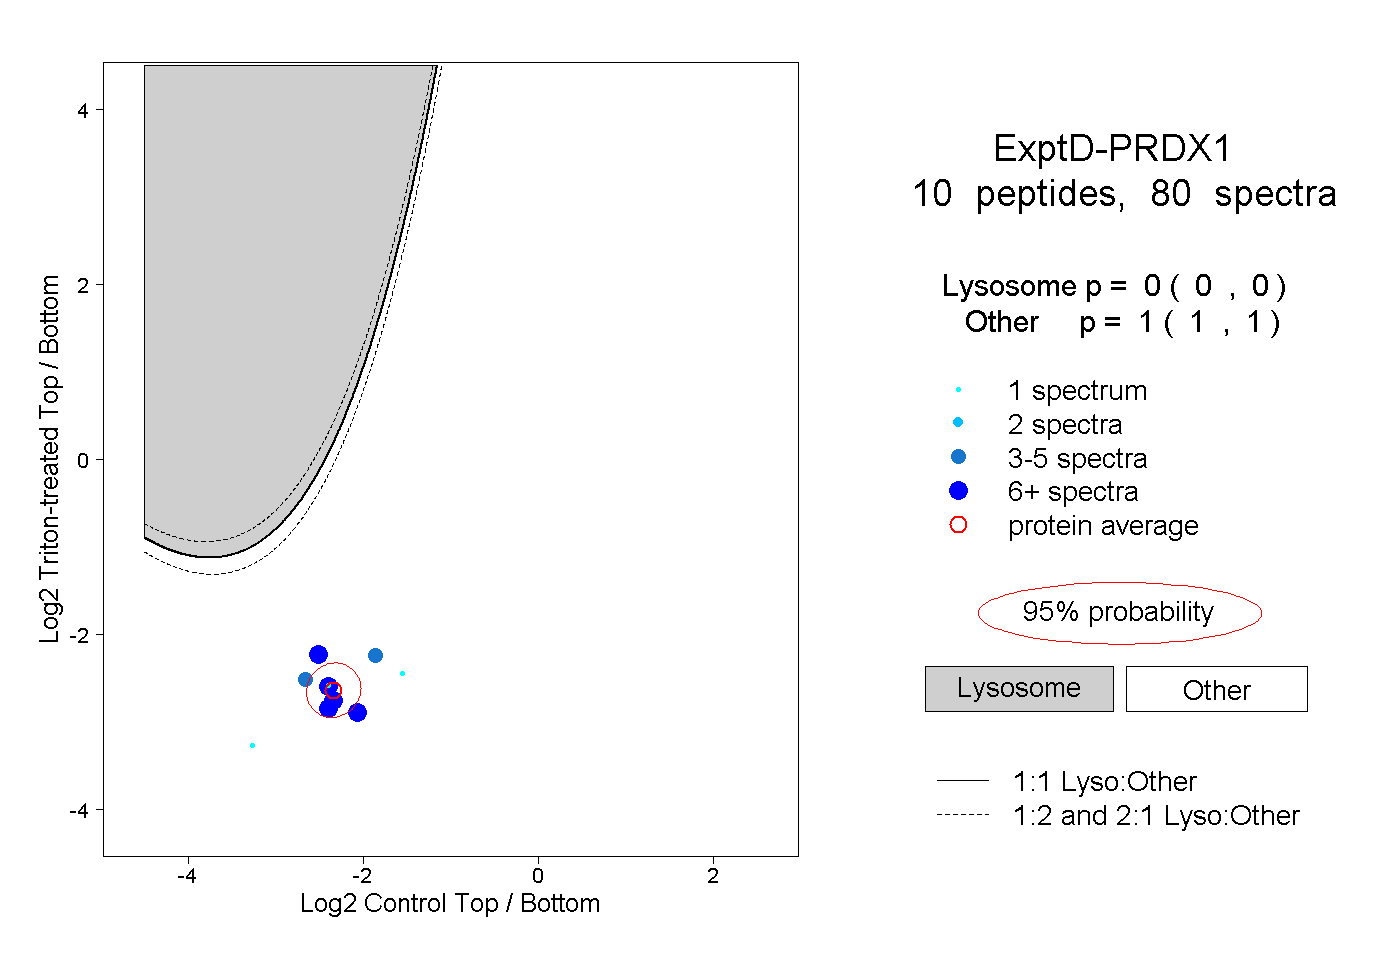
0.000 | 0.000
1.000 | 1.000