 2
2peptides
spectra
0.176 | 0.227
0.000 | 0.065
0.550 | 0.755
0.000 | 0.000
0.000 | 0.064
0.000 | 0.127
0.000 | 0.042
0.000 | 0.000
5peptides
spectra
0.000 | 0.004
0.996 | 1.000
| Plot | Mito | Lyso | Perox | ER | Golgi | PM | Cytosol | Nucleus | |||||
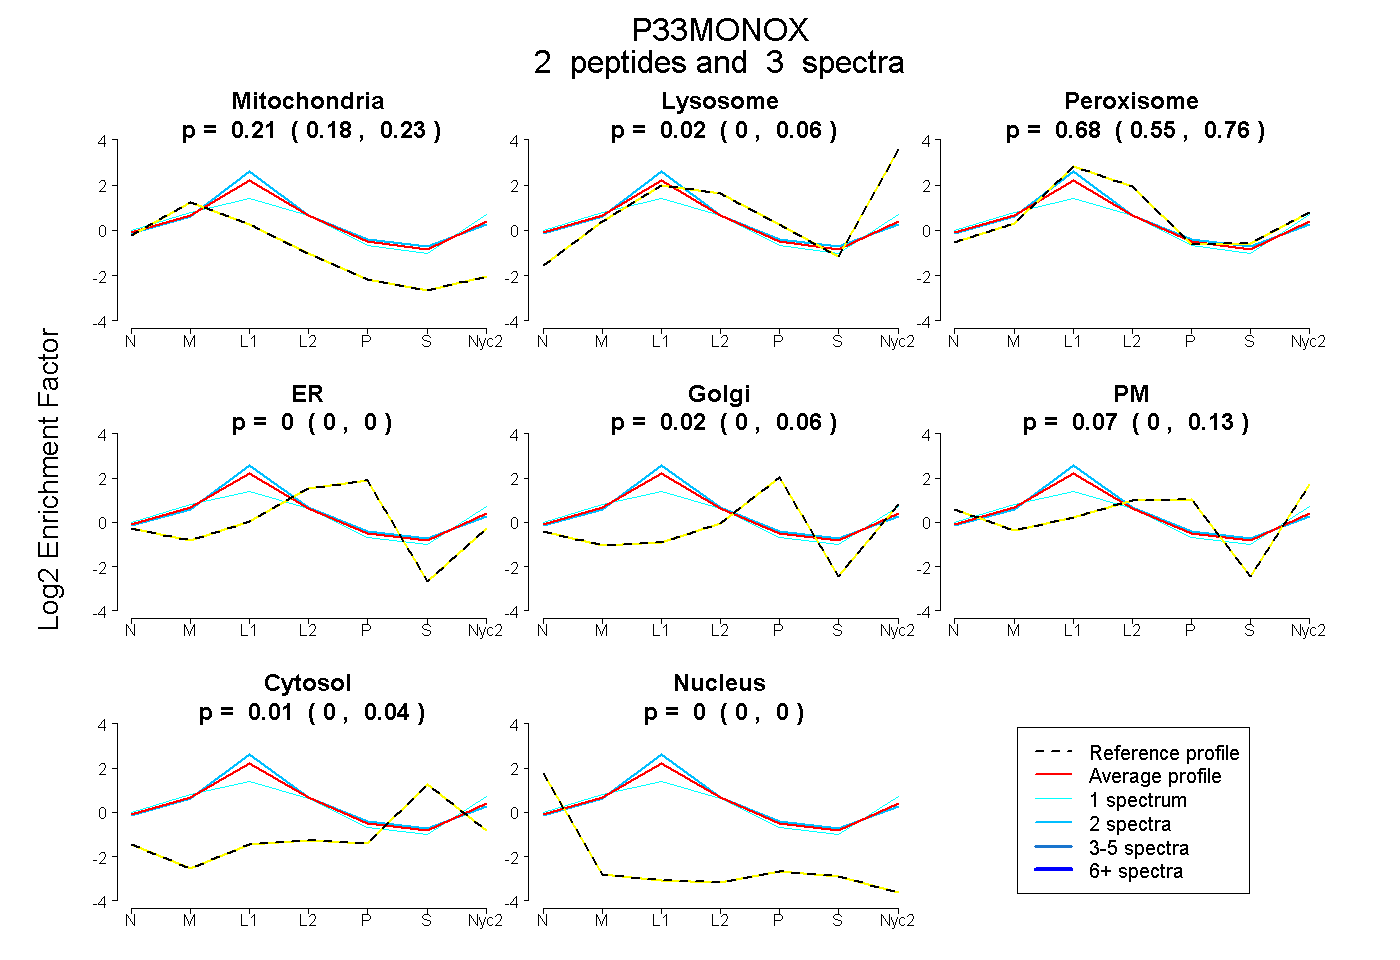
| Expt A |
2 peptides |
3 spectra |
|
0.205 0.176 | 0.227 |
0.018 0.000 | 0.065 |
0.678 0.550 | 0.755 |
0.000 0.000 | 0.000 |
0.018 0.000 | 0.064 |
0.070 0.000 | 0.127 |
0.010 0.000 | 0.042 |
0.000 0.000 | 0.000 |
||
| Plot | Lyso | Other | |||||||||||
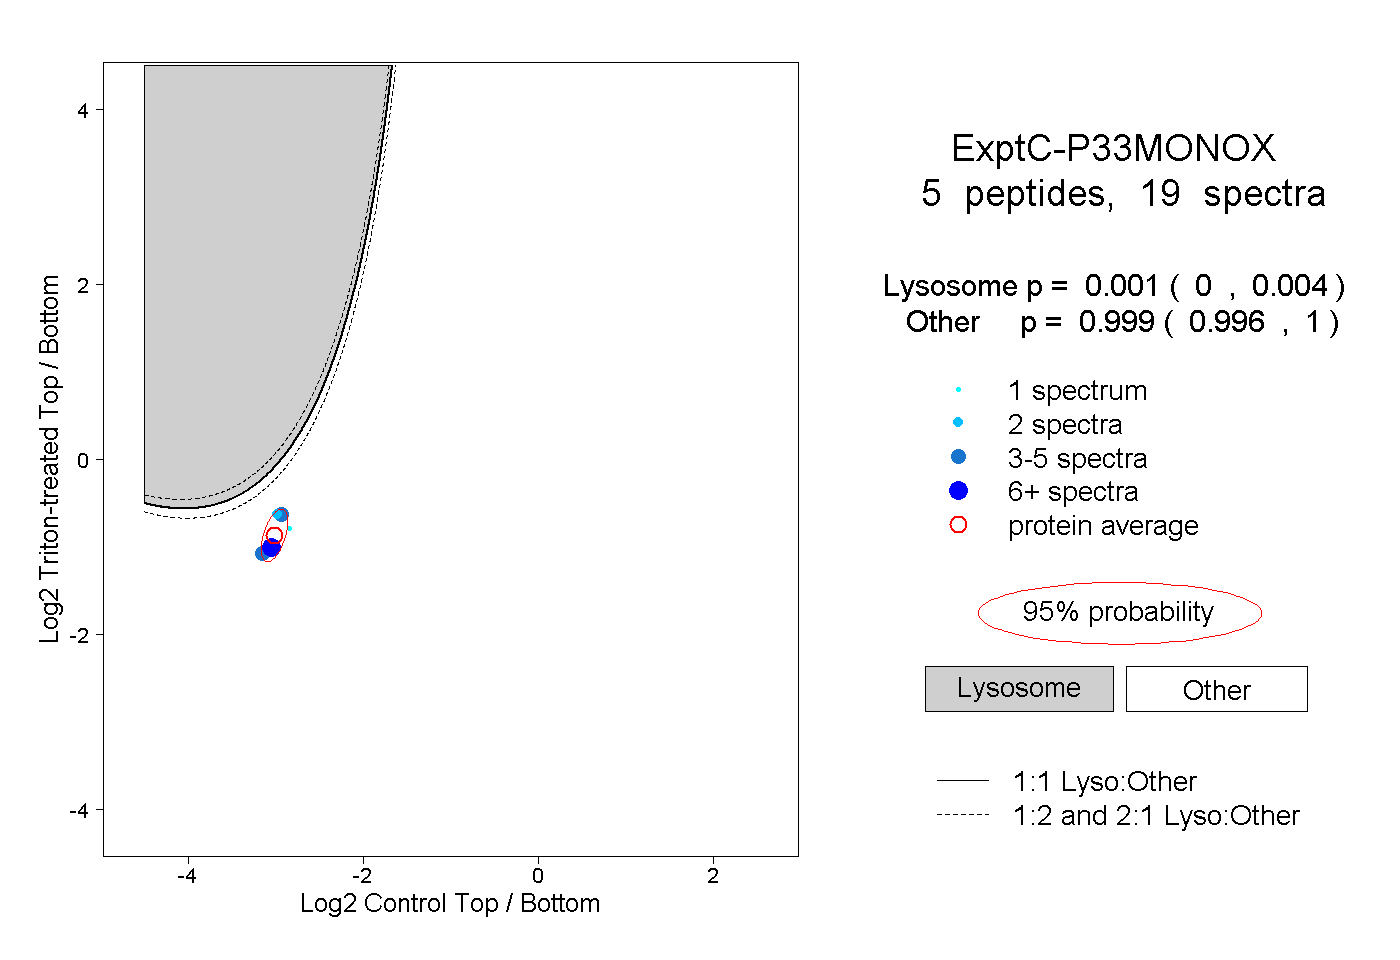
| Expt C |
5 peptides |
19 spectra |
|
0.001 0.000 | 0.004 |
0.999 0.996 | 1.000 |
| 8 spectra, GLTTEETK | 0.000 | 1.000 | ||||||||
| 1 spectrum, SDSGFAIQAYK | 0.000 | 1.000 | ||||||||
| 5 spectra, QTQESIQR | 0.003 | 0.997 | ||||||||
| 3 spectra, DAGYTPHK | 0.000 | 1.000 | ||||||||
| 2 spectra, VAEALHK | 0.004 | 0.996 |