 8
8peptides
spectra
0.000 | 0.000
0.405 | 0.509
0.000 | 0.000
0.053 | 0.305
0.072 | 0.266
0.057 | 0.241
0.000 | 0.038
0.000 | 0.000
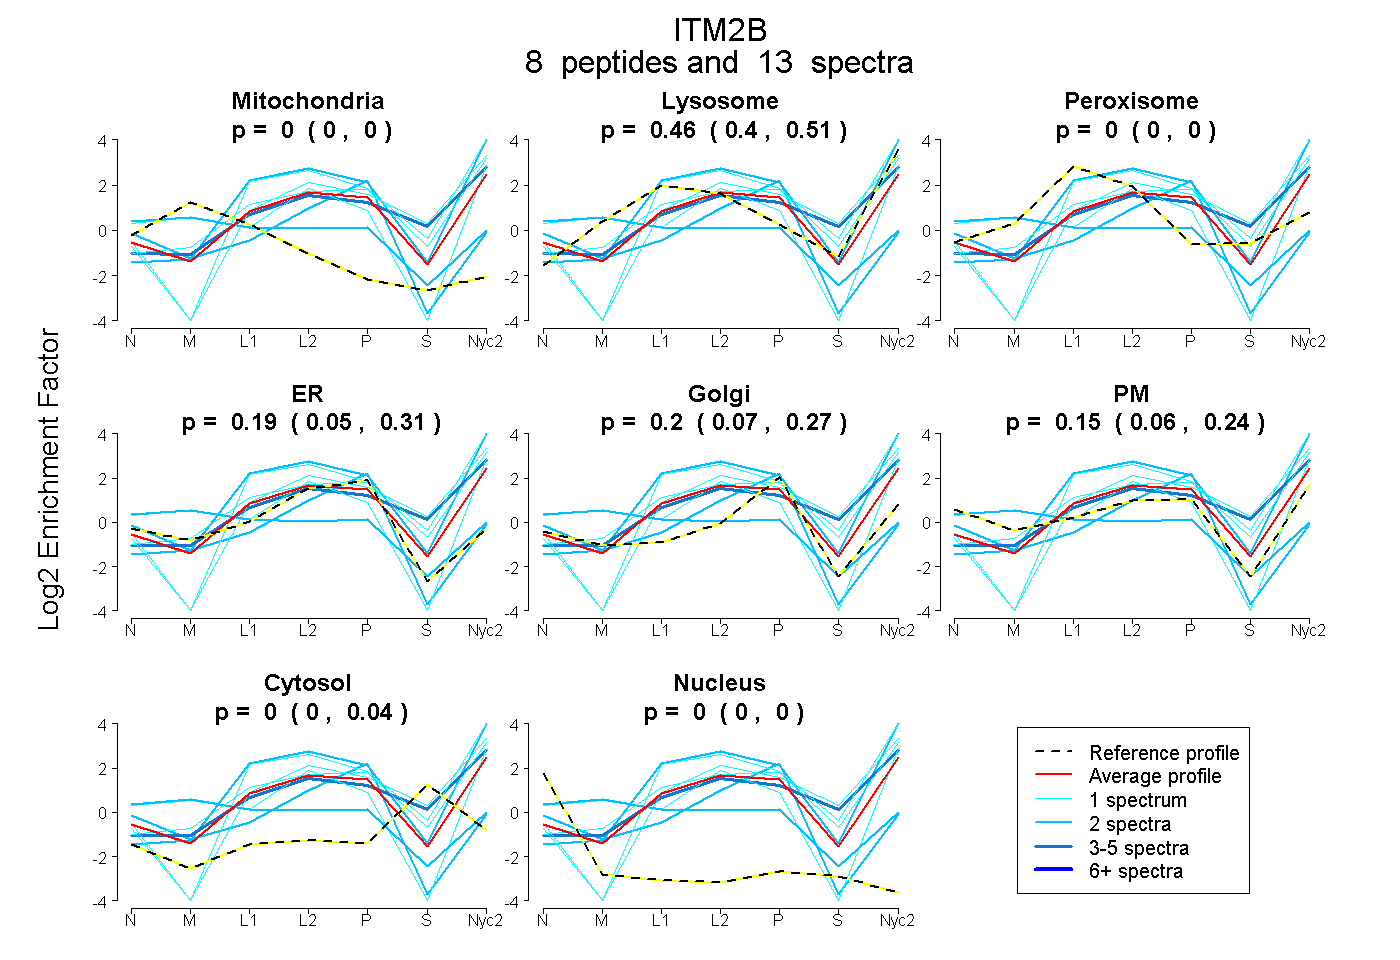
| Plot | Mito | Lyso | Perox | ER | Golgi | PM | Cytosol | Nucleus | |||||
| Expt A |
8 peptides |
13 spectra |
|
0.000 0.000 | 0.000 |
0.463 0.405 | 0.509 |
0.000 0.000 | 0.000 |
0.188 0.053 | 0.305 |
0.195 0.072 | 0.266 |
0.153 0.057 | 0.241 |
0.000 0.000 | 0.038 |
0.000 0.000 | 0.000 |
| 3 spectra, IENVDHLGFFIYR | 0.000 | 0.664 | 0.000 | 0.000 | 0.160 | 0.000 | 0.176 | 0.000 | ||
| 2 spectra, DPDDVVPVGQR | 0.000 | 0.874 | 0.000 | 0.126 | 0.000 | 0.000 | 0.000 | 0.000 | ||
| 1 spectrum, VTFNSALAQK | 0.000 | 0.588 | 0.000 | 0.006 | 0.175 | 0.000 | 0.231 | 0.000 | ||
| 2 spectra, EASNCFTIR | 0.000 | 0.000 | 0.000 | 0.698 | 0.275 | 0.000 | 0.000 | 0.027 | ||
| 1 spectrum, SSEEALIAPPDAVAVDCK | 0.000 | 0.761 | 0.000 | 0.146 | 0.025 | 0.016 | 0.051 | 0.000 | ||
| 1 spectrum, LTAYLDLNLDK | 0.000 | 0.139 | 0.000 | 0.000 | 0.000 | 0.861 | 0.000 | 0.000 | ||
| 2 spectra, YFALQPDDVYYCGLK | 0.397 | 0.000 | 0.000 | 0.042 | 0.068 | 0.493 | 0.000 | 0.000 | ||
| 1 spectrum, YQTIEENIK | 0.000 | 0.712 | 0.000 | 0.000 | 0.288 | 0.000 | 0.000 | 0.000 |
| Plot | Mito | Lyso or Perox | ER | Golgi | PM | Cytosol | Nucleus | ||||||
| Expt B |
1 peptide |
1 spectrum |
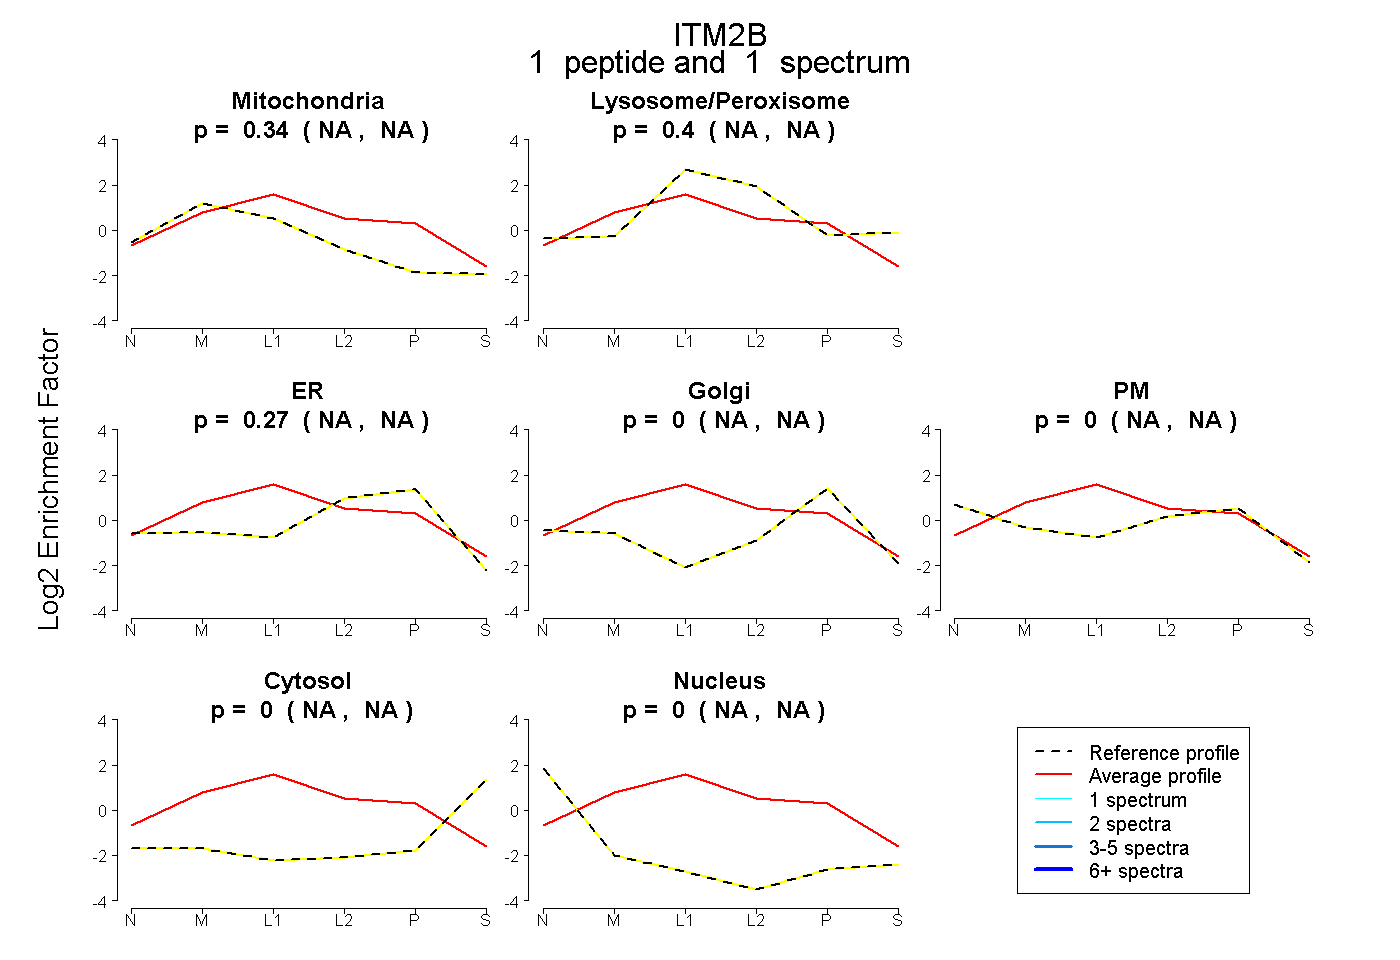 |
0.337 NA | NA |
0.396 NA | NA |
0.267 NA | NA |
0.000 NA | NA |
0.000 NA | NA |
0.000 NA | NA |
0.000 NA | NA |
|||
| Plot | Lyso | Other | |||||||||||
| Expt C |
6 peptides |
30 spectra |
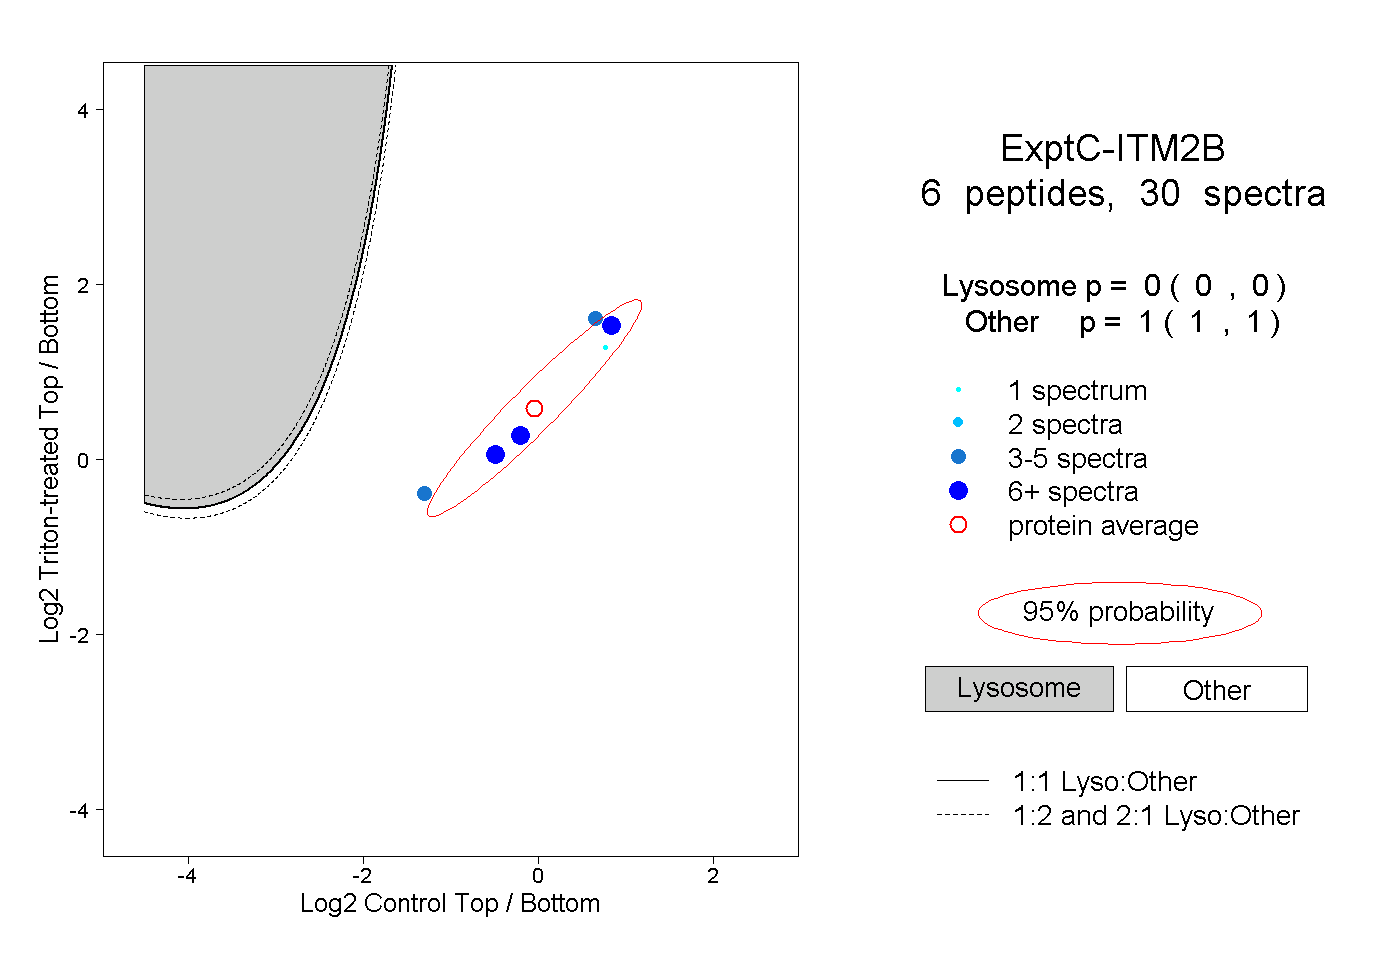 |
0.000 0.000 | 0.000 |
1.000 1.000 | 1.000 |
||||||||
| Plot | Lyso | Other | |||||||||||
| Expt D |
2 peptides |
4 spectra |
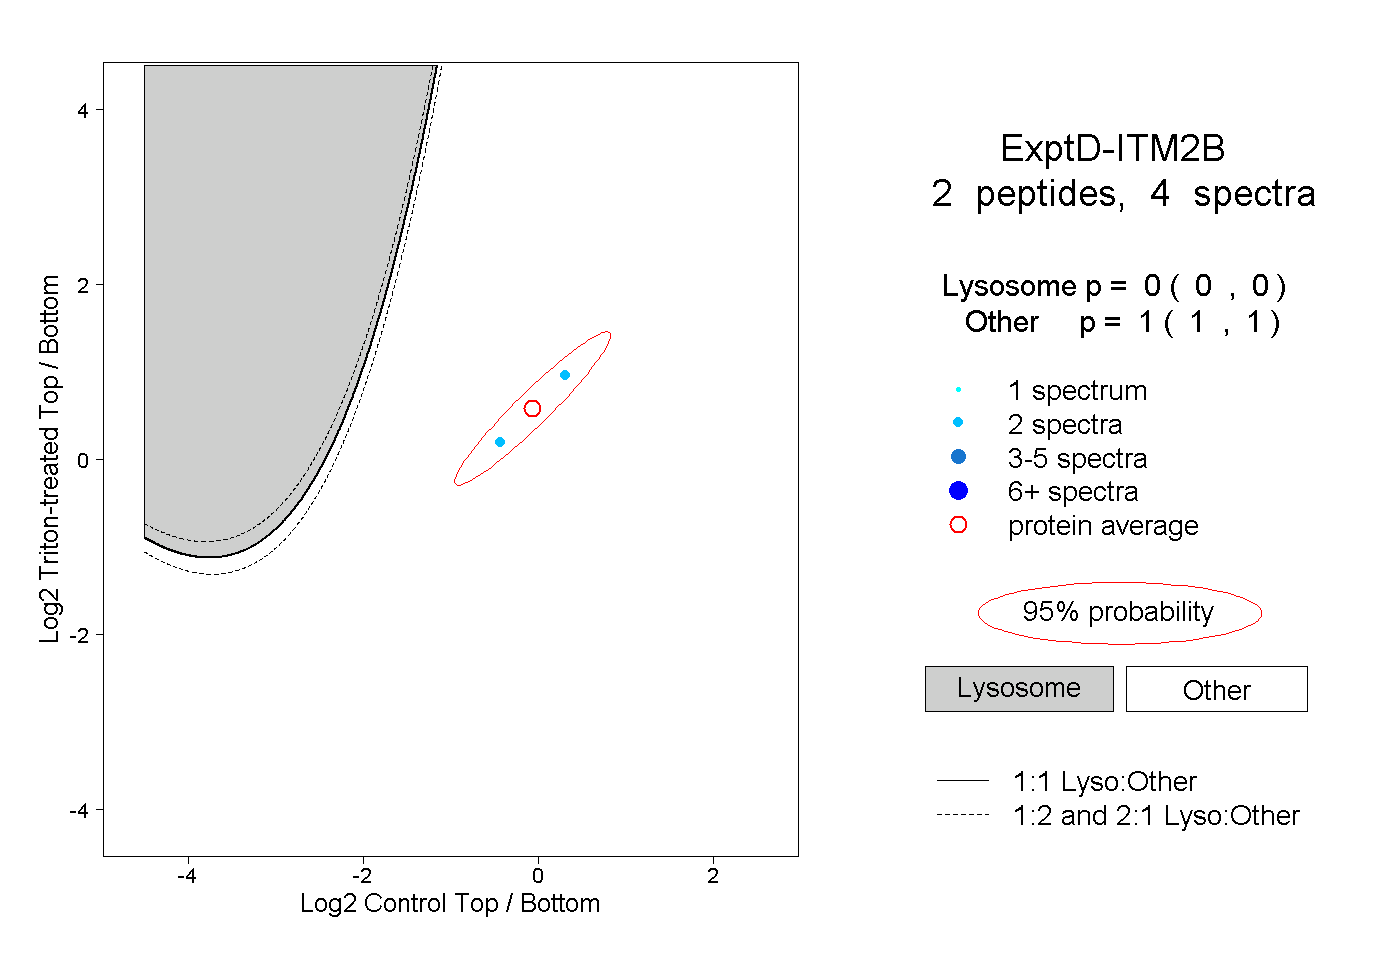 |
0.000 0.000 | 0.000 |
1.000 1.000 | 1.000 |