 3
3peptides
spectra
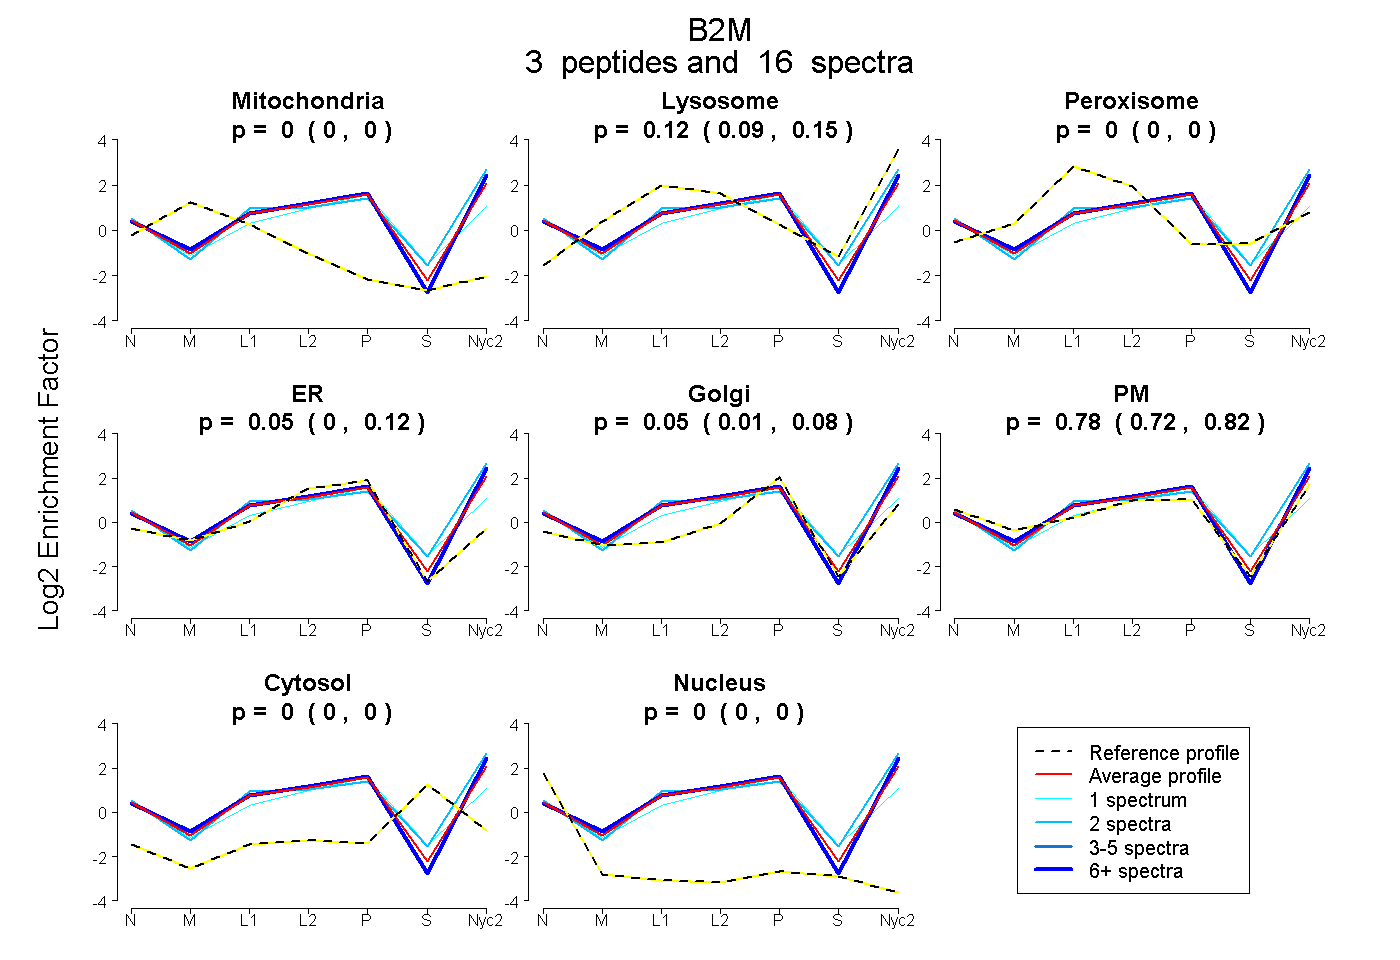
0.000 | 0.000
0.091 | 0.150
0.000 | 0.000
0.000 | 0.115
0.013 | 0.076
0.716 | 0.824
0.000 | 0.000
0.000 | 0.000
1peptide
spectra
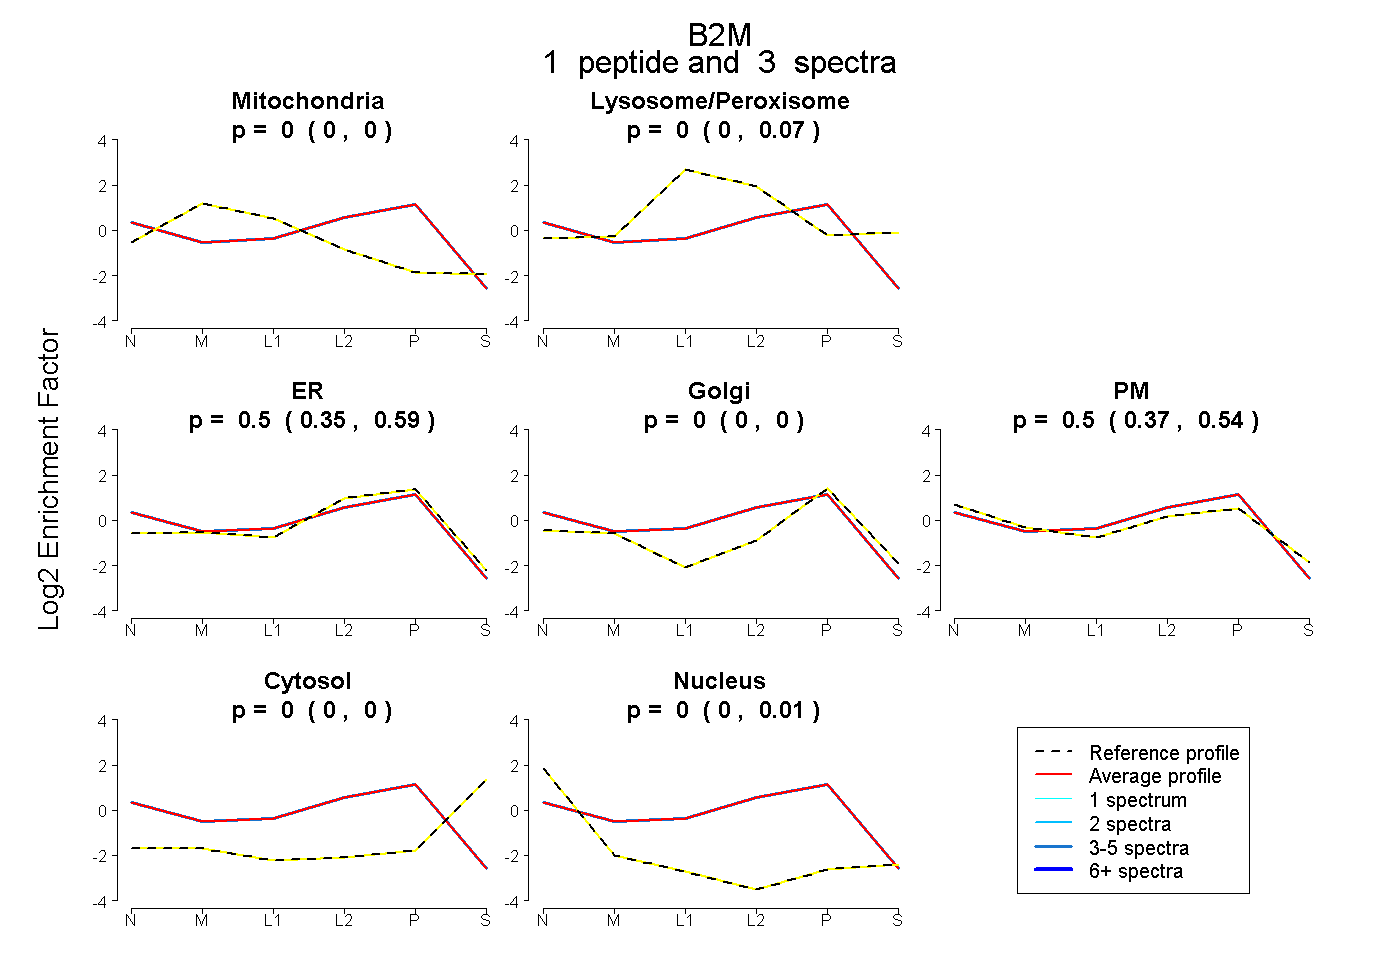
0.000 | 0.000
0.000 | 0.074
0.352 | 0.591
0.000 | 0.000
0.373 | 0.543
0.000 | 0.000
0.000 | 0.008
3peptides
spectra
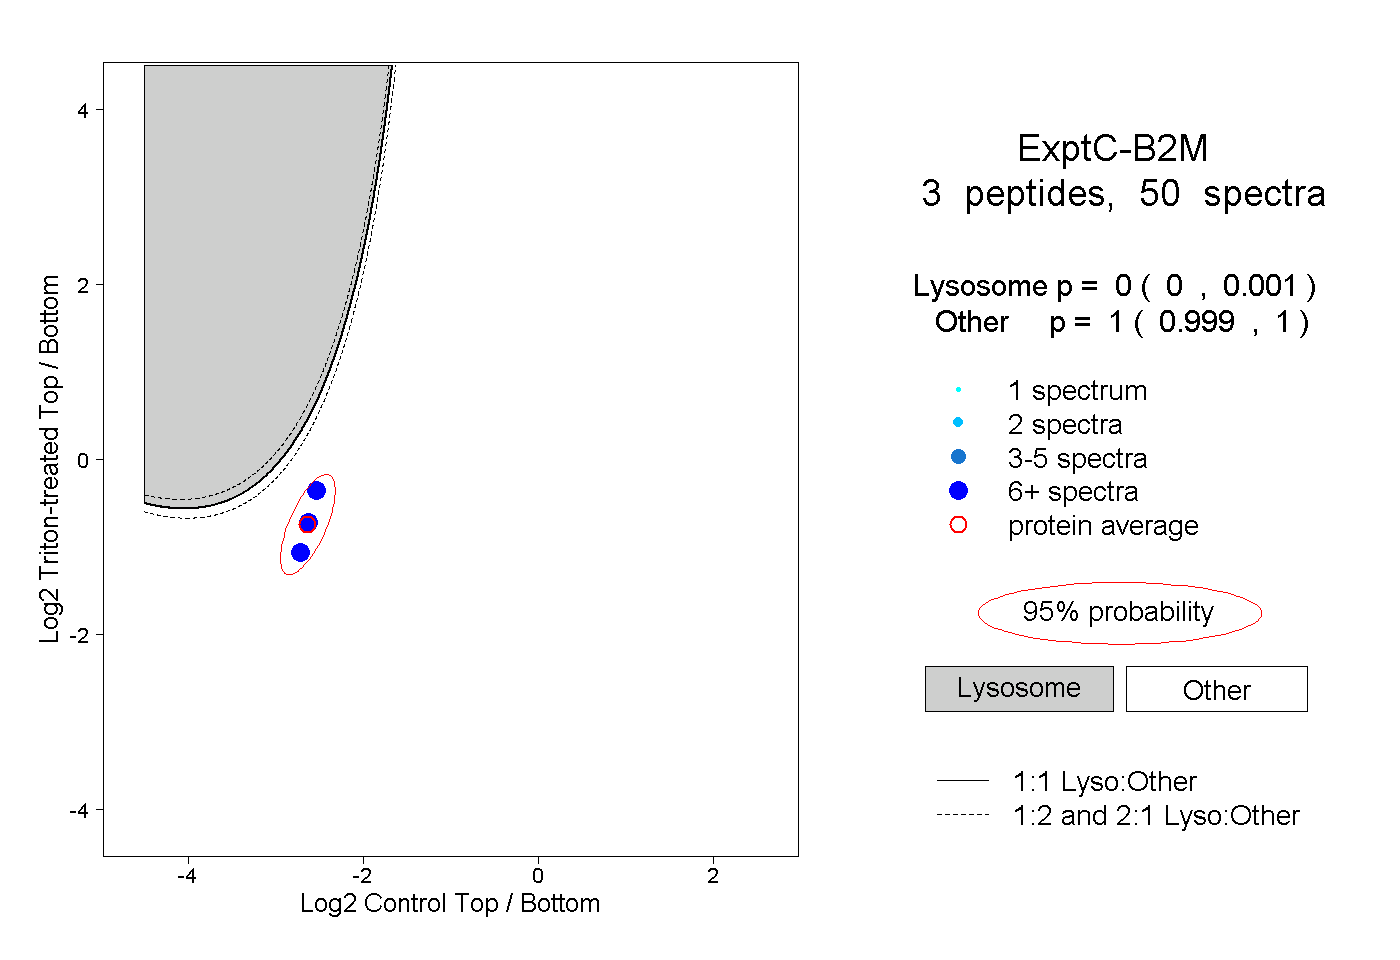
0.000 | 0.001
0.999 | 1.000
1peptide
spectrum
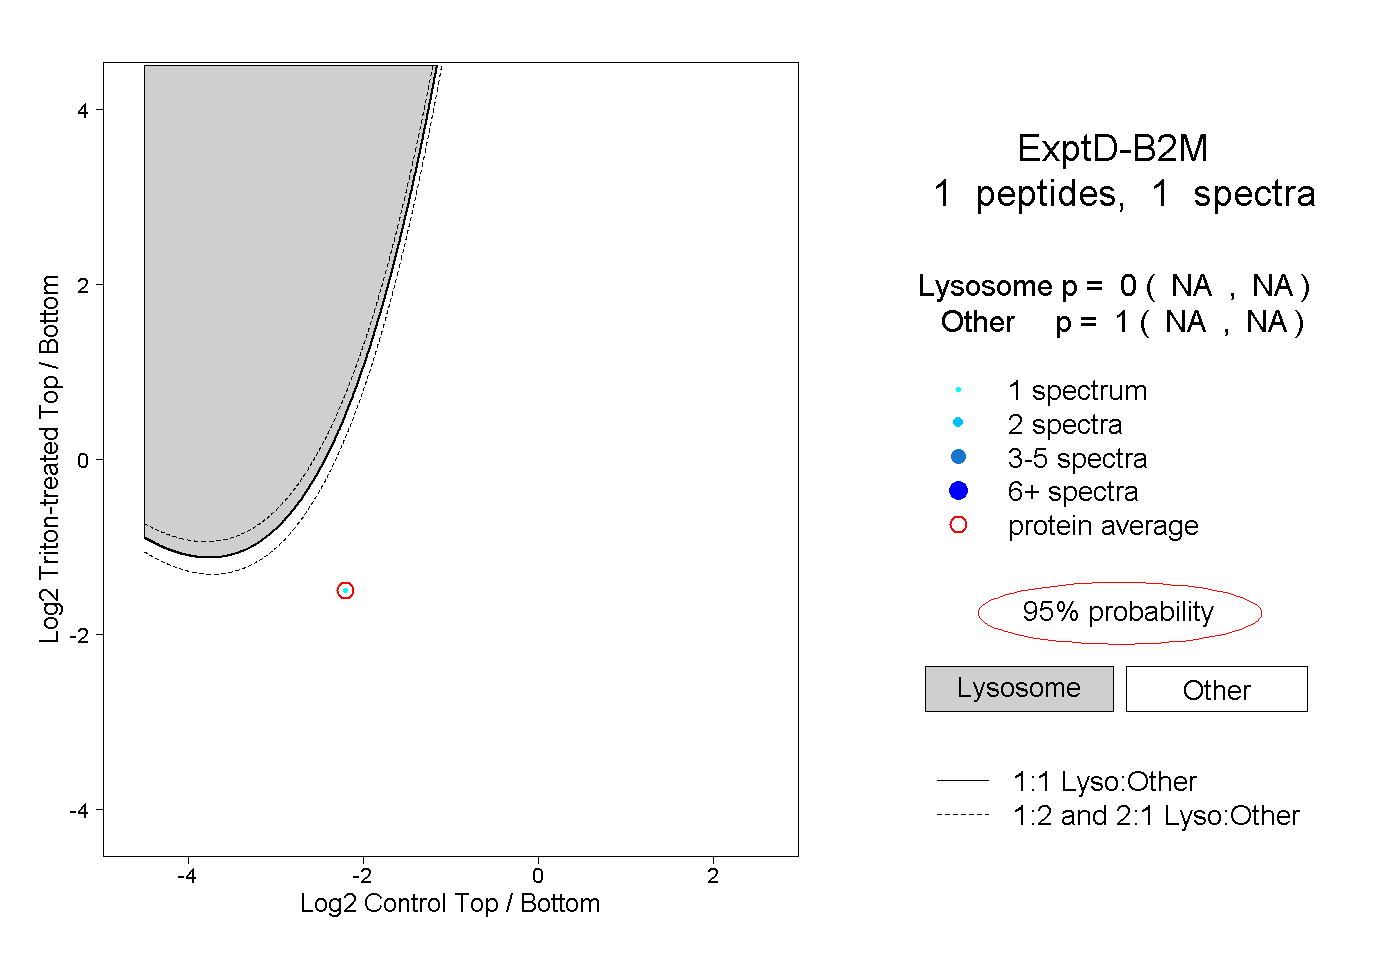
NA | NA
NA | NA