 4
4peptides
spectra
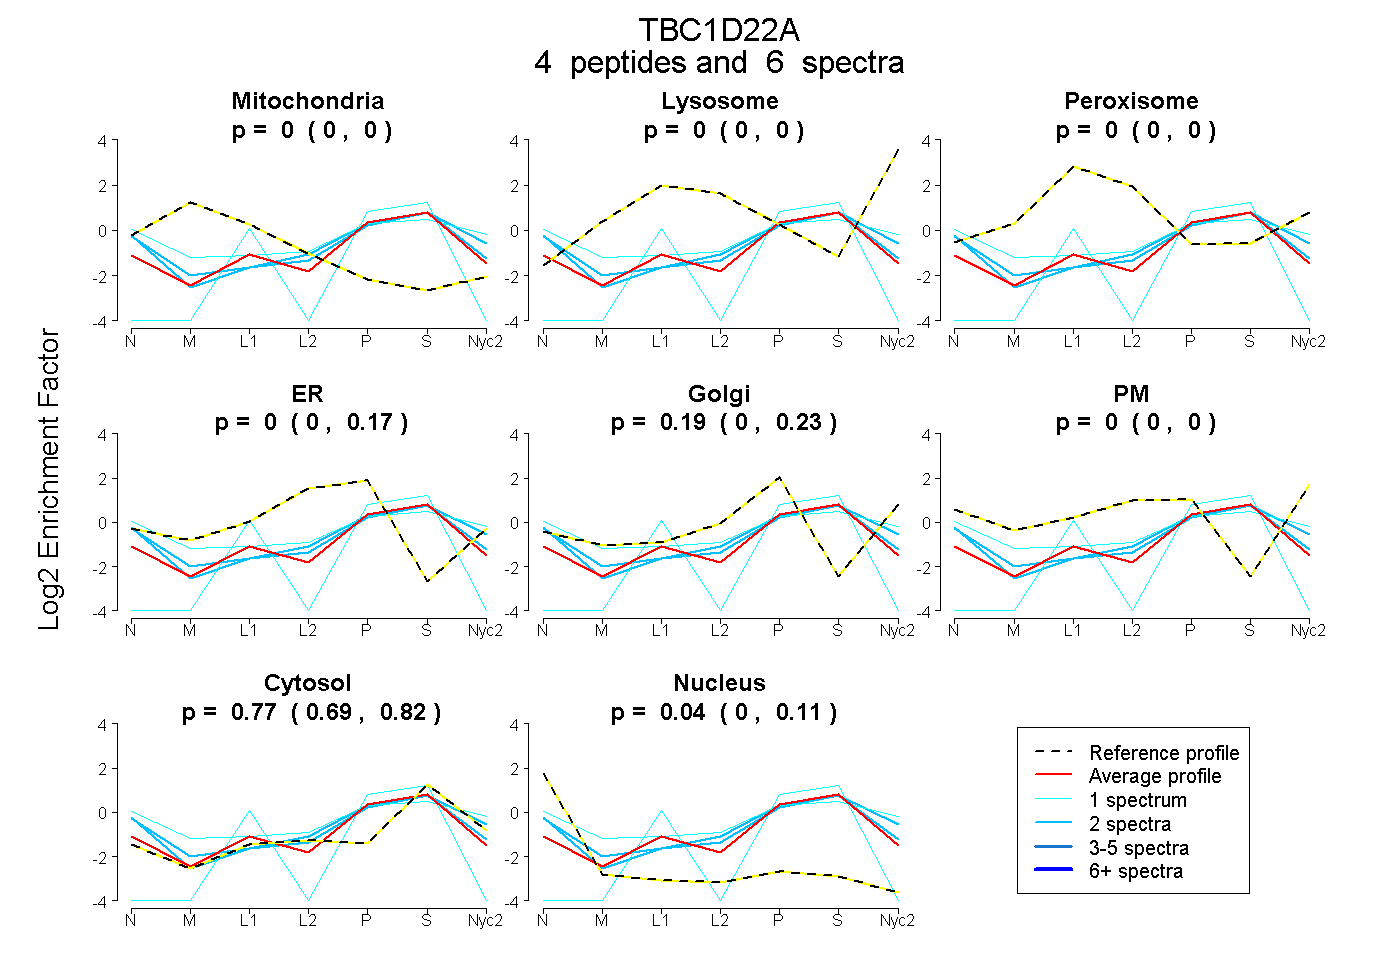
0.000 | 0.000
0.000 | 0.000
0.000 | 0.000
0.000 | 0.169
0.000 | 0.235
0.000 | 0.000
0.692 | 0.821
0.000 | 0.112
| Plot | Mito | Lyso | Perox | ER | Golgi | PM | Cytosol | Nucleus | |||||
| Expt A |
4 peptides |
6 spectra |
|
0.000 0.000 | 0.000 |
0.000 0.000 | 0.000 |
0.000 0.000 | 0.000 |
0.000 0.000 | 0.169 |
0.193 0.000 | 0.235 |
0.000 0.000 | 0.000 |
0.766 0.692 | 0.821 |
0.041 0.000 | 0.112 |
| 1 spectrum, YLQFAFR | 0.000 | 0.000 | 0.000 | 0.000 | 0.178 | 0.226 | 0.589 | 0.007 | ||
| 2 spectra, NDEVHQDTYR | 0.000 | 0.000 | 0.000 | 0.000 | 0.278 | 0.000 | 0.695 | 0.028 | ||
| 1 spectrum, QIHIDIPR | 0.000 | 0.000 | 0.000 | 0.000 | 0.000 | 0.000 | 0.977 | 0.023 | ||
| 2 spectra, HLDGHEVR | 0.000 | 0.000 | 0.000 | 0.000 | 0.241 | 0.000 | 0.674 | 0.085 |
| Plot | Lyso | Other | |||||||||||
| Expt C |
2 peptides |
4 spectra |
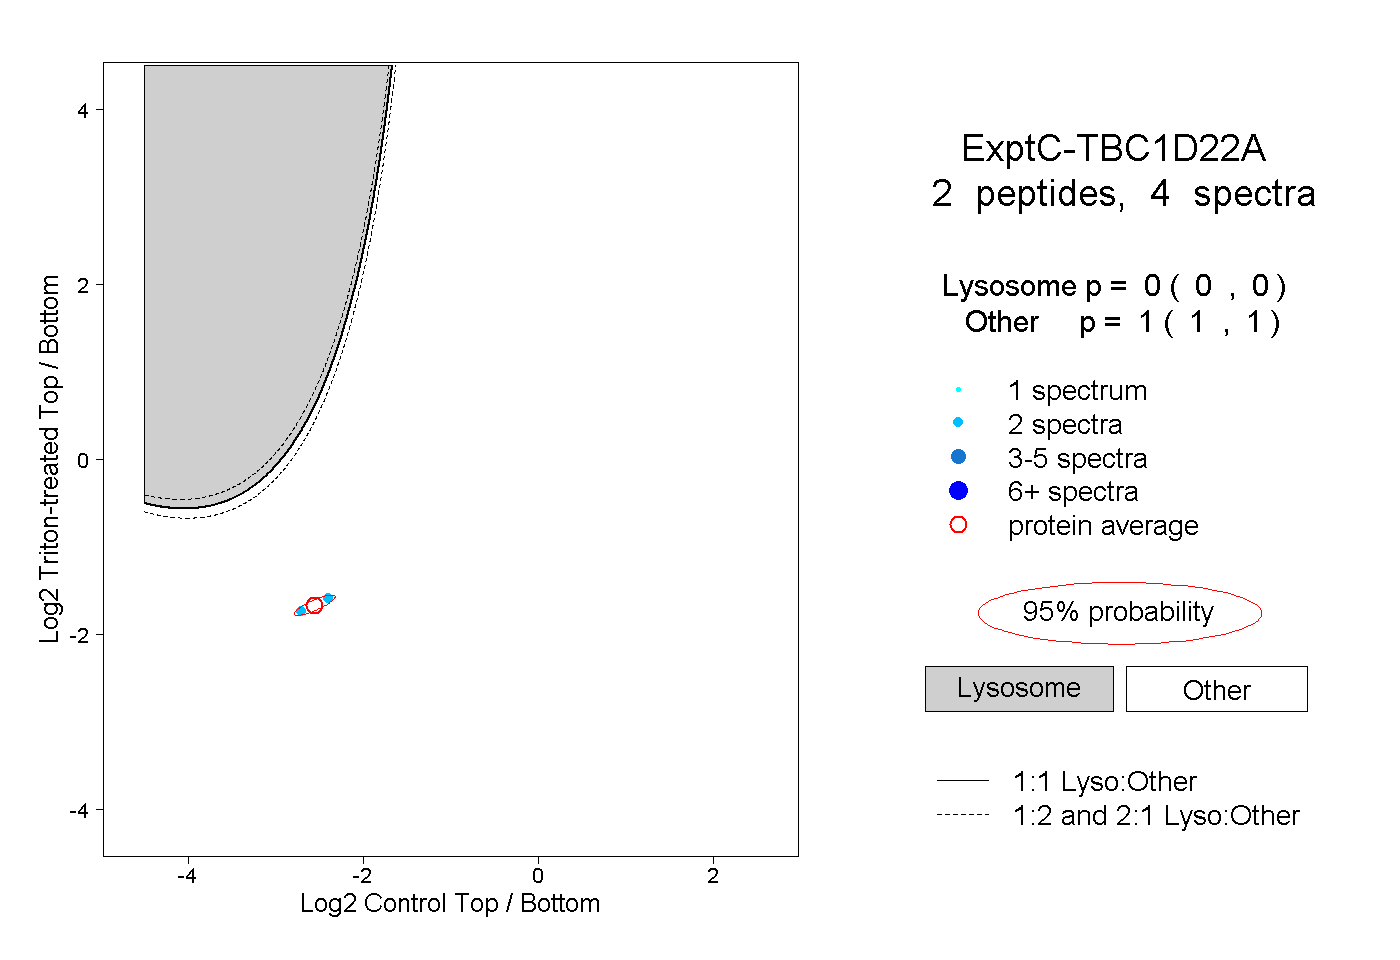 |
0.000 0.000 | 0.000 |
1.000 1.000 | 1.000 |