 2
2peptides
spectra
0.000 | 0.000
0.016 | 0.055
0.180 | 0.247
0.000 | 0.044
0.322 | 0.496
0.177 | 0.313
0.029 | 0.093
0.000 | 0.000
3peptides
spectra
0.000 | 0.000
1.000 | 1.000
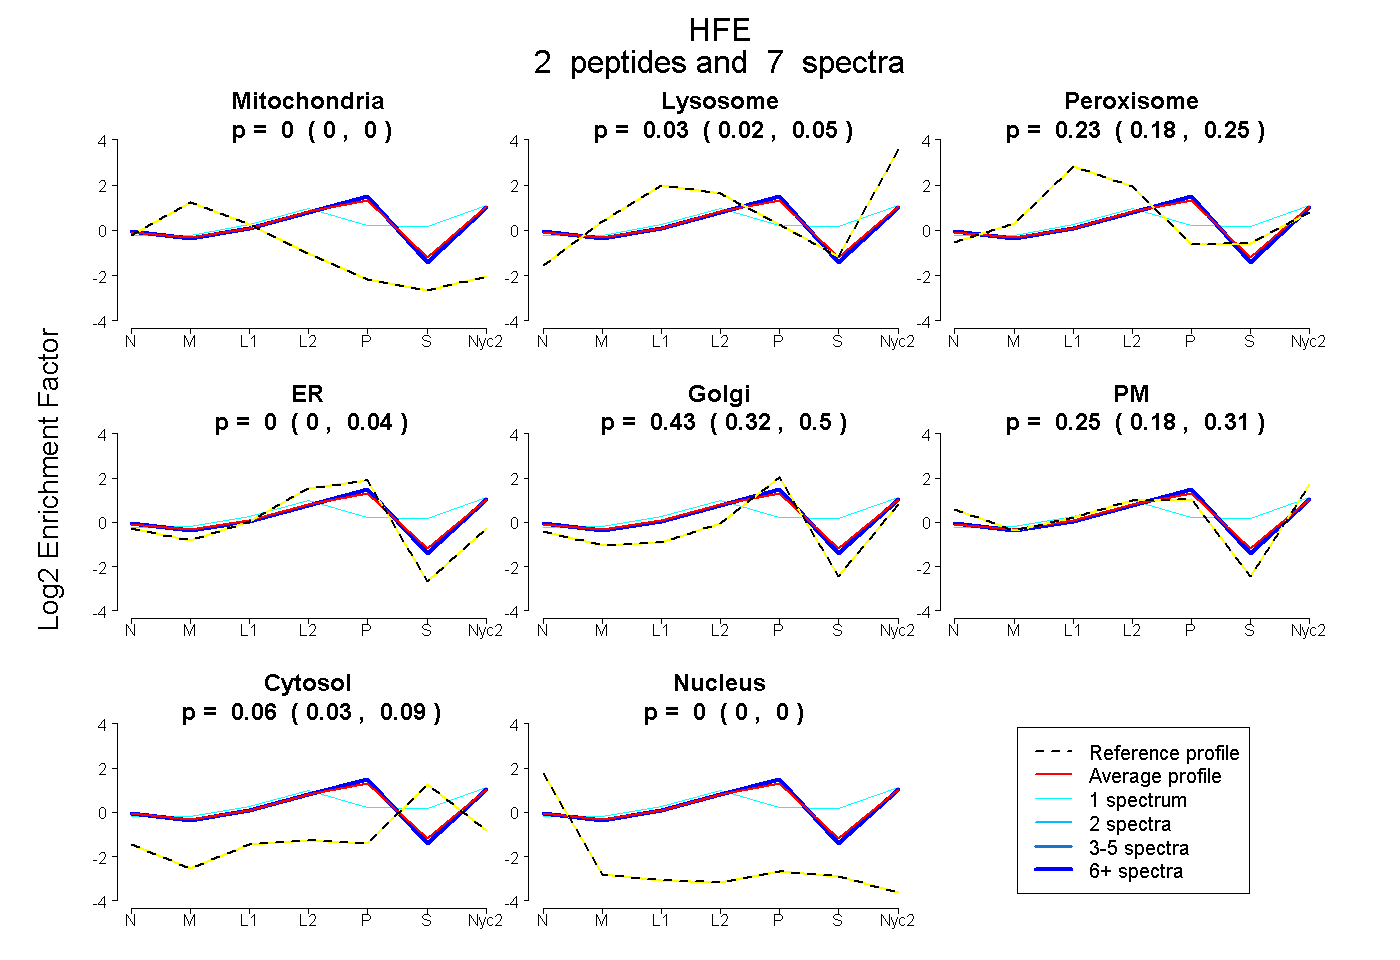
| Plot | Mito | Lyso | Perox | ER | Golgi | PM | Cytosol | Nucleus | |||||
| Expt A |
2 peptides |
7 spectra |
|
0.000 0.000 | 0.000 |
0.034 0.016 | 0.055 |
0.227 0.180 | 0.247 |
0.000 0.000 | 0.044 |
0.429 0.322 | 0.496 |
0.249 0.177 | 0.313 |
0.060 0.029 | 0.093 |
0.000 0.000 | 0.000 |
||
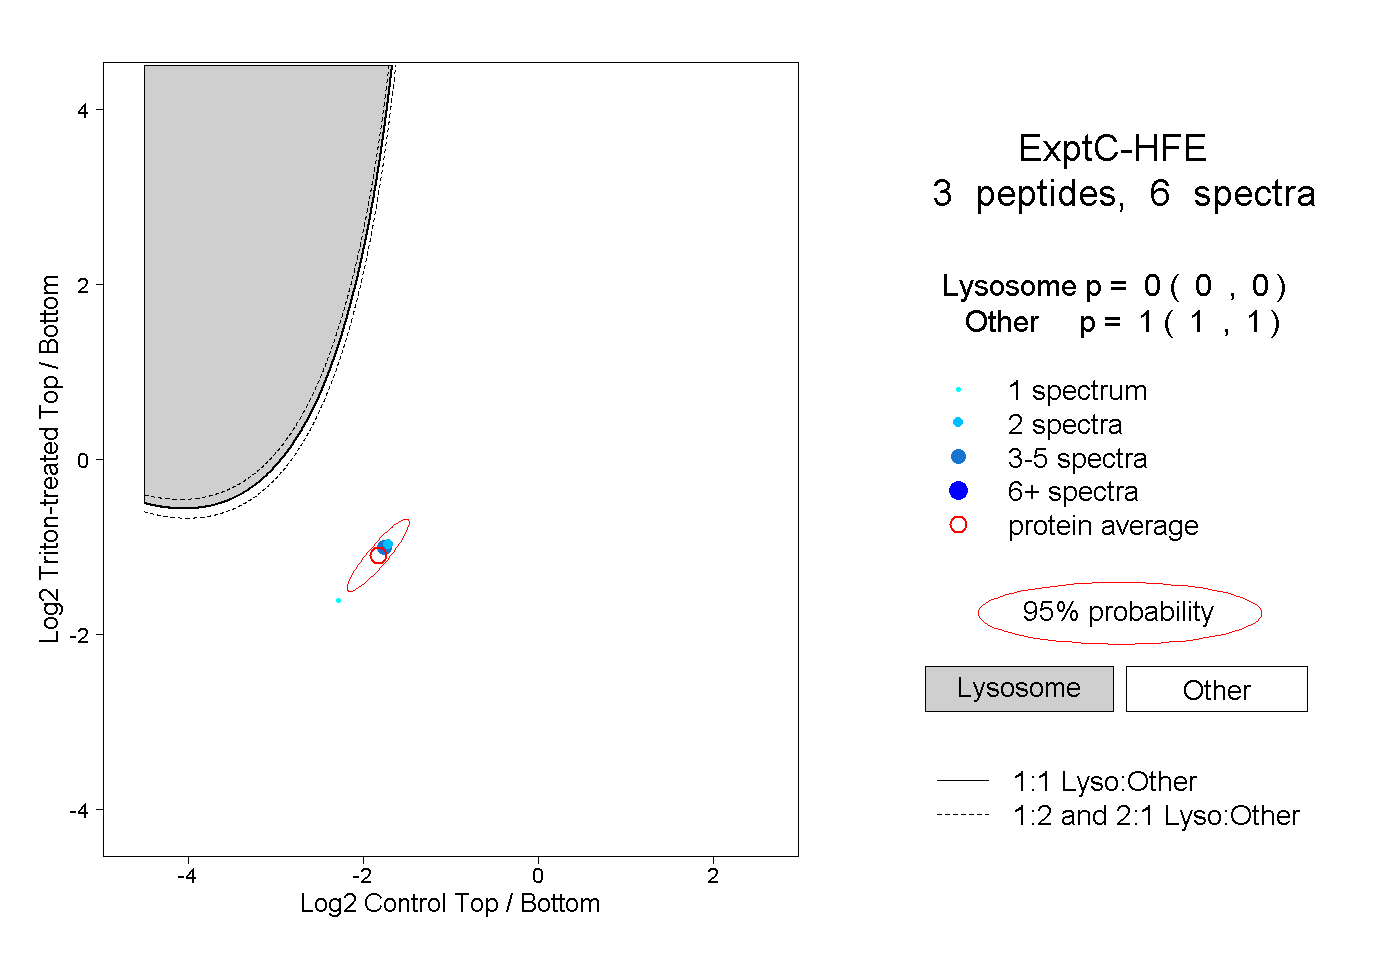
| Plot | Lyso | Other | |||||||||||
| Expt C |
3 peptides |
6 spectra |
|
0.000 0.000 | 0.000 |
1.000 1.000 | 1.000 |