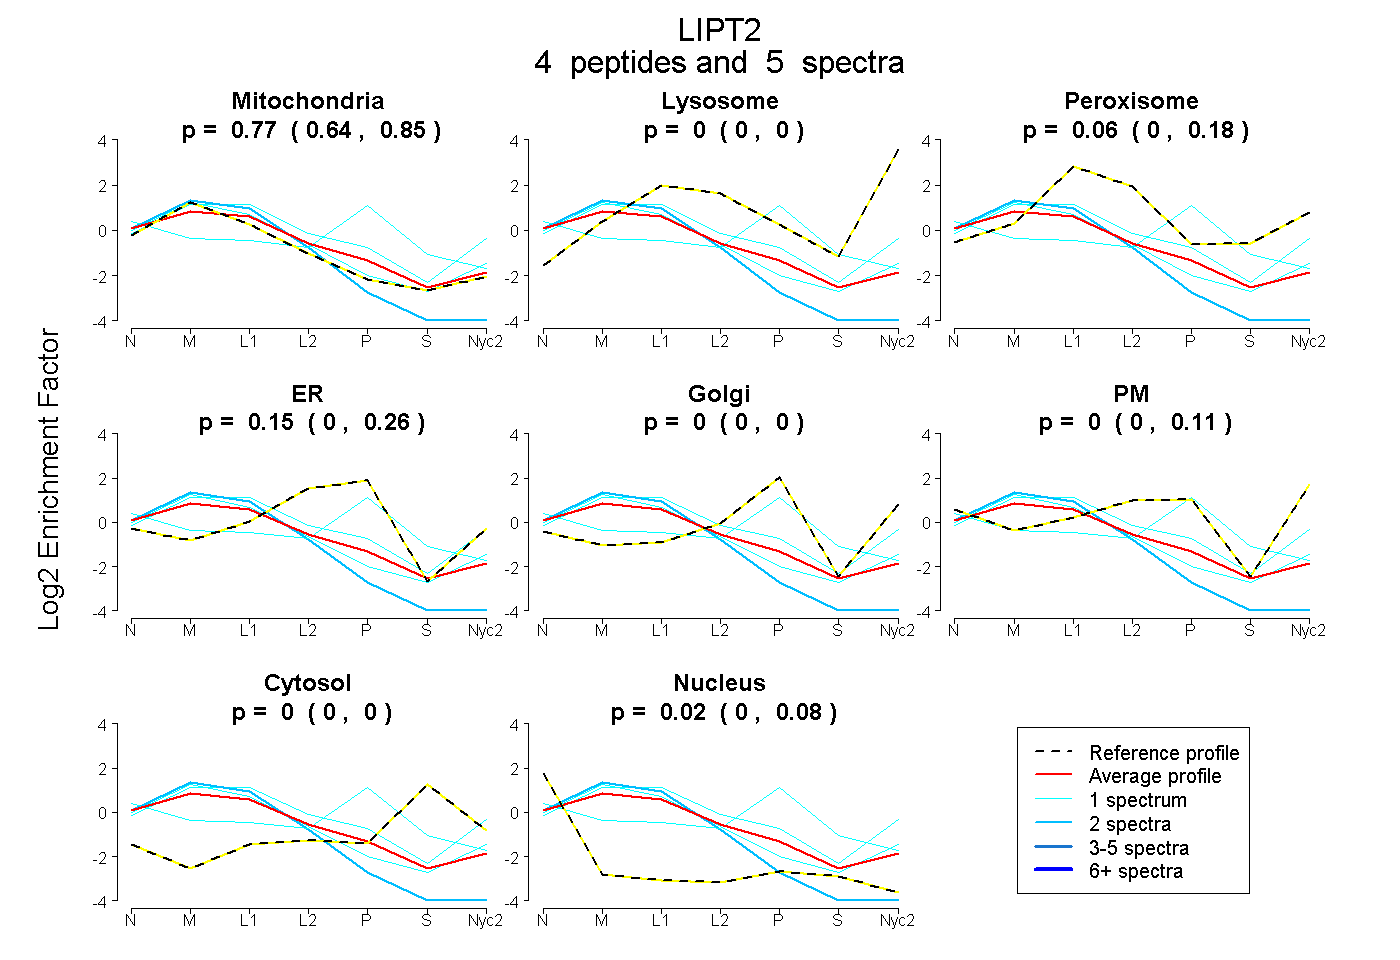
 4
4peptides
spectra
0.640 | 0.850
0.000 | 0.000
0.000 | 0.176
0.000 | 0.258
0.000 | 0.004
0.000 | 0.111
0.000 | 0.000
0.000 | 0.084
| Plot | Mito | Lyso | Perox | ER | Golgi | PM | Cytosol | Nucleus | |||||
| Expt A |
4 peptides |
5 spectra |
|
0.768 0.640 | 0.850 |
0.000 0.000 | 0.000 |
0.064 0.000 | 0.176 |
0.147 0.000 | 0.258 |
0.000 0.000 | 0.004 |
0.000 0.000 | 0.111 |
0.000 0.000 | 0.000 |
0.022 0.000 | 0.084 |
| 1 spectrum, ALGAEVR | 0.860 | 0.001 | 0.089 | 0.000 | 0.000 | 0.049 | 0.000 | 0.000 | ||
| 1 spectrum, QLQADPRPR | 0.187 | 0.000 | 0.000 | 0.387 | 0.140 | 0.000 | 0.179 | 0.107 | ||
| 1 spectrum, ARPPPYTGVWLGER | 0.557 | 0.103 | 0.147 | 0.000 | 0.000 | 0.193 | 0.000 | 0.000 | ||
| 2 spectra, GGLATFHGPGQLLCHPVLDLR | 0.970 | 0.000 | 0.000 | 0.000 | 0.000 | 0.000 | 0.000 | 0.030 |
| Plot | Lyso | Other | |||||||||||
| Expt C |
9 peptides |
18 spectra |
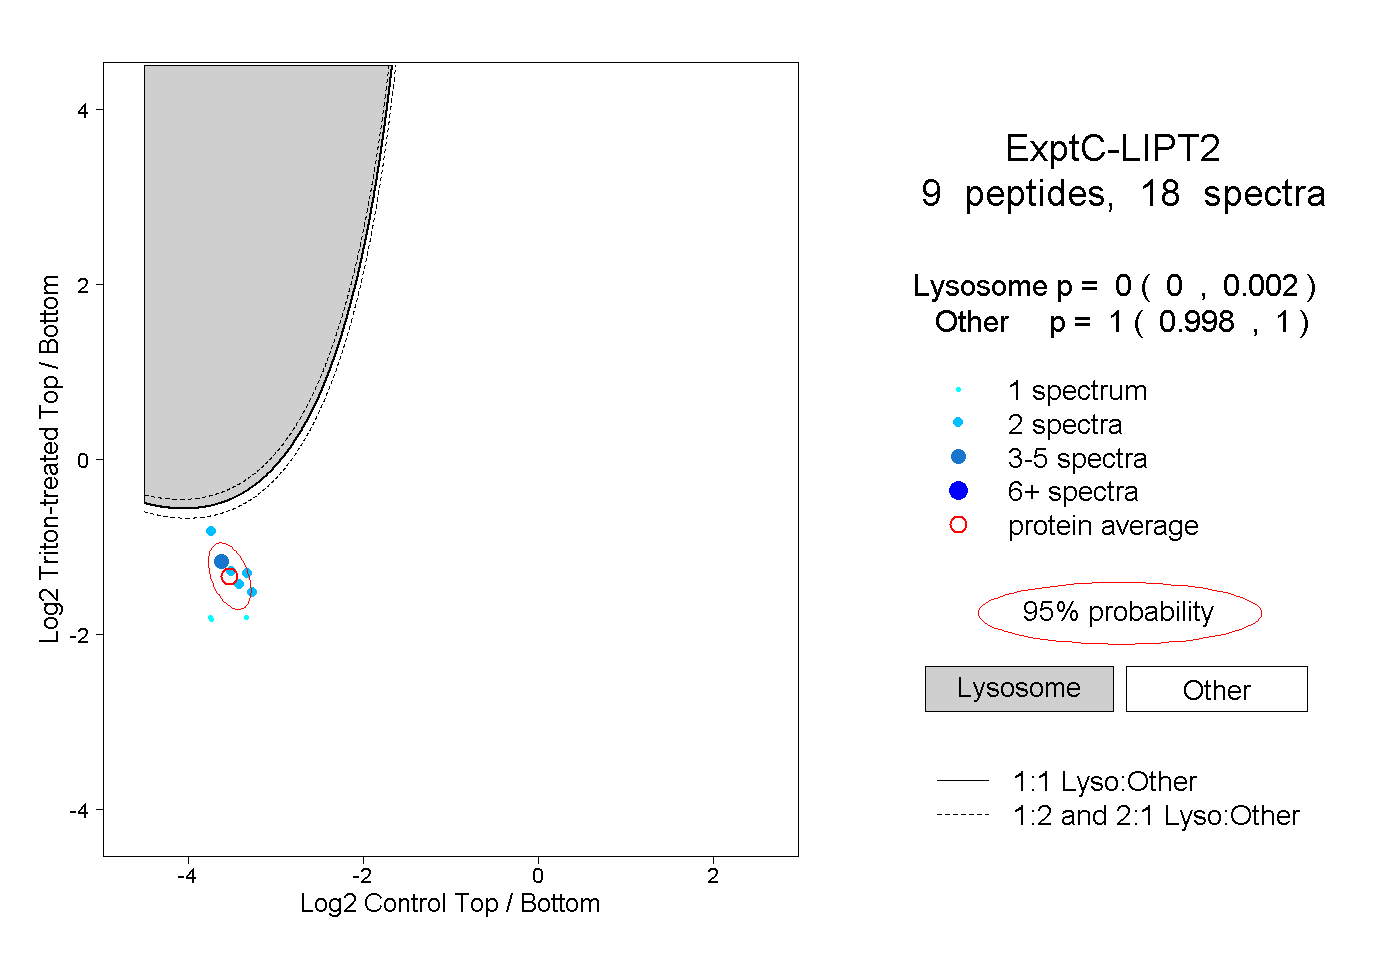 |
0.000 0.000 | 0.002 |
1.000 0.998 | 1.000 |