 6
6peptides
spectra
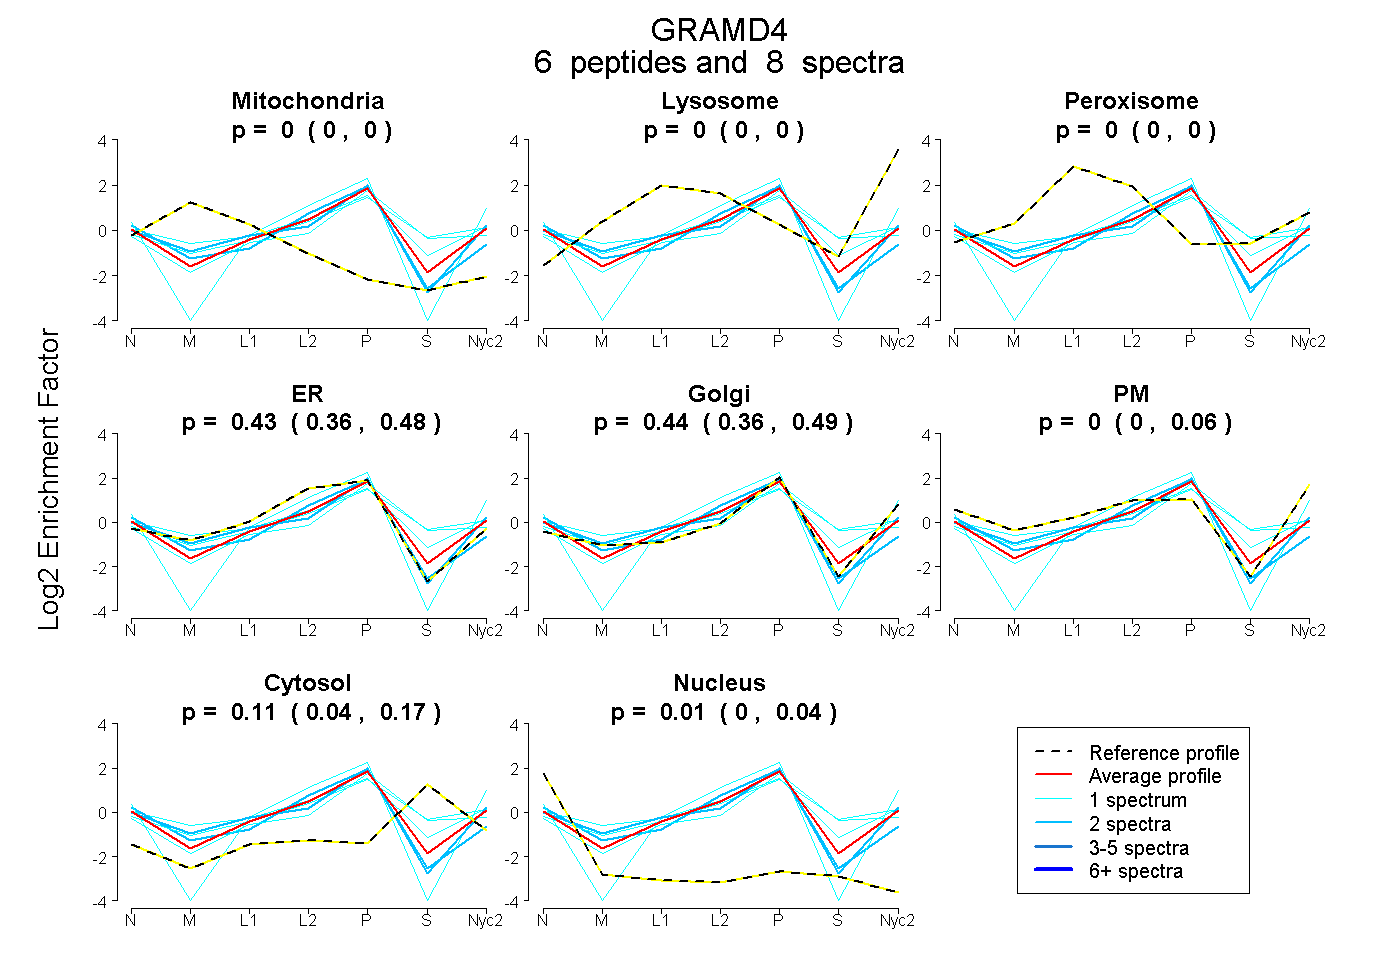
0.000 | 0.000
0.000 | 0.000
0.000 | 0.000
0.359 | 0.482
0.360 | 0.490
0.000 | 0.060
0.039 | 0.170
0.000 | 0.045
| Plot | Mito | Lyso | Perox | ER | Golgi | PM | Cytosol | Nucleus | |||||
| Expt A |
6 peptides |
8 spectra |
|
0.000 0.000 | 0.000 |
0.000 0.000 | 0.000 |
0.000 0.000 | 0.000 |
0.433 0.359 | 0.482 |
0.436 0.360 | 0.490 |
0.004 0.000 | 0.060 |
0.114 0.039 | 0.170 |
0.013 0.000 | 0.045 |
| 2 spectra, MADILEK | 0.010 | 0.000 | 0.000 | 0.344 | 0.563 | 0.051 | 0.000 | 0.032 | ||
| 1 spectrum, AGATVSR | 0.000 | 0.000 | 0.109 | 0.297 | 0.335 | 0.108 | 0.151 | 0.000 | ||
| 1 spectrum, LMDITDIQK | 0.000 | 0.000 | 0.000 | 0.266 | 0.380 | 0.000 | 0.354 | 0.000 | ||
| 2 spectra, FGEYVEDFR | 0.000 | 0.000 | 0.000 | 0.666 | 0.226 | 0.000 | 0.000 | 0.108 | ||
| 1 spectrum, GHLEIALLEK | 0.000 | 0.000 | 0.000 | 0.444 | 0.535 | 0.000 | 0.000 | 0.022 | ||
| 1 spectrum, GAKPVTNFVK | 0.000 | 0.000 | 0.128 | 0.230 | 0.372 | 0.000 | 0.271 | 0.000 |
| Plot | Mito | Lyso or Perox | ER | Golgi | PM | Cytosol | Nucleus | ||||||
| Expt B |
2 peptides |
2 spectra |
 |
0.000 NA | NA |
0.000 NA | NA |
0.777 NA | NA |
0.157 NA | NA |
0.010 NA | NA |
0.000 NA | NA |
0.056 NA | NA |
|||
| Plot | Lyso | Other | |||||||||||
| Expt C |
1 peptide |
1 spectrum |
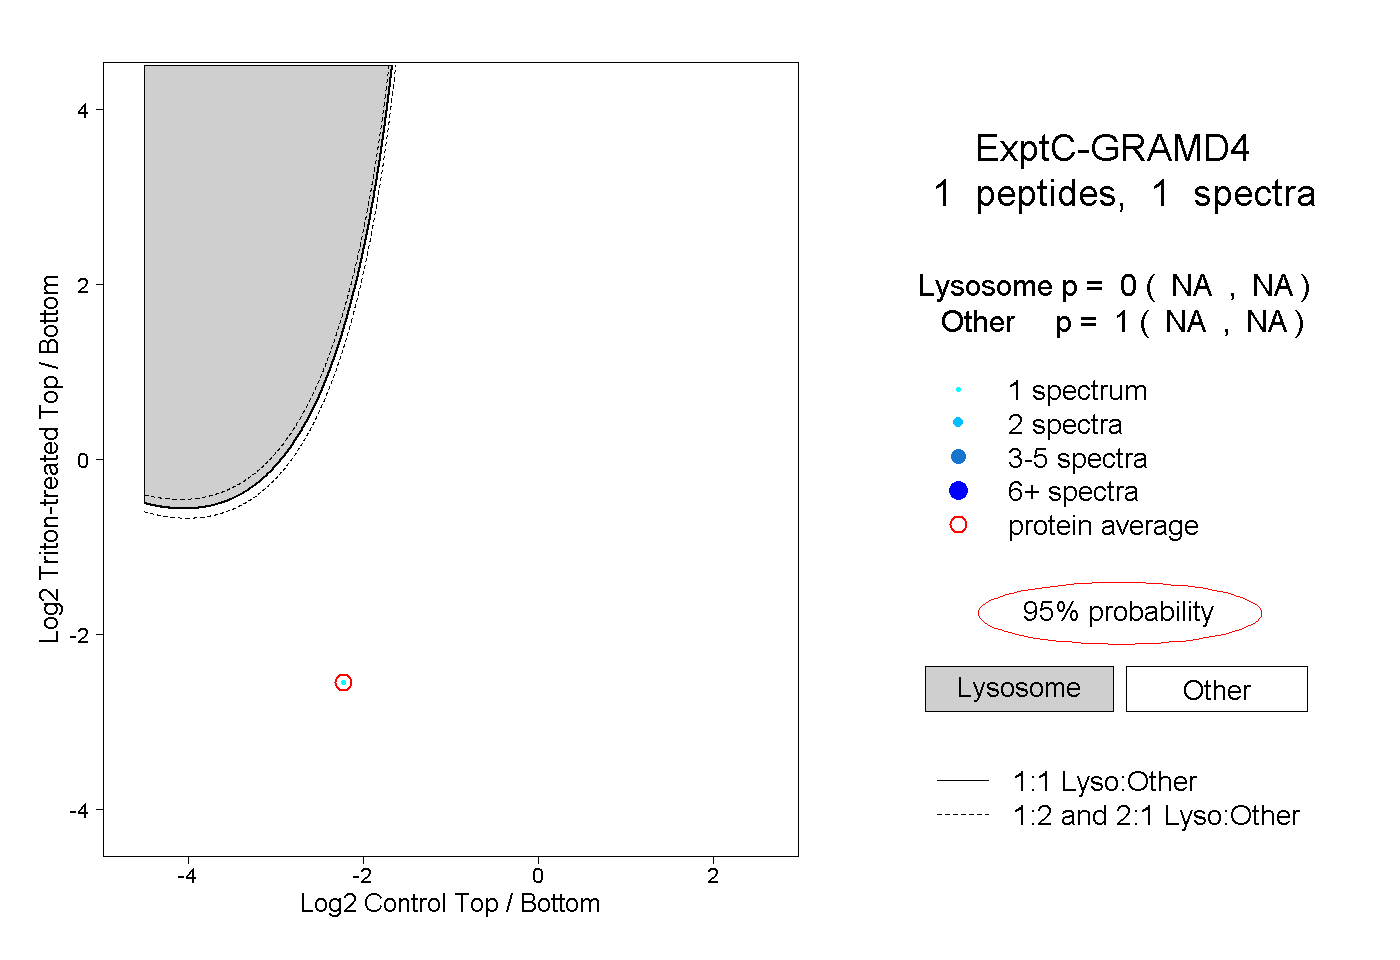 |
0.000 NA | NA |
1.000 NA | NA |