13
13peptides
spectra
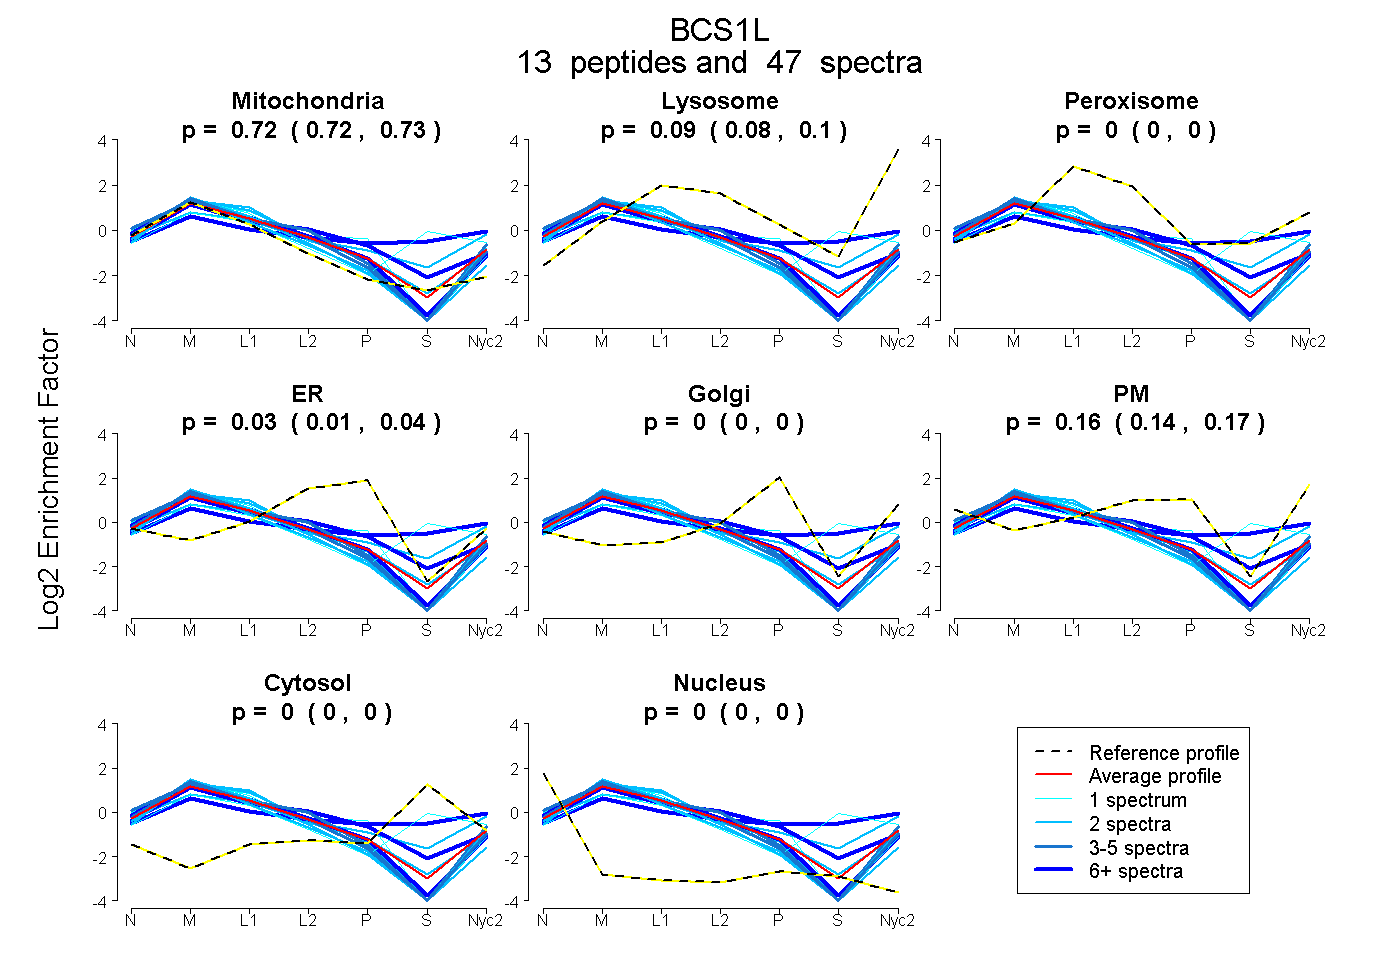
0.719 | 0.730
0.081 | 0.102
0.000 | 0.000
0.013 | 0.037
0.000 | 0.000
0.139 | 0.171
0.000 | 0.000
0.000 | 0.000
8peptides
spectra
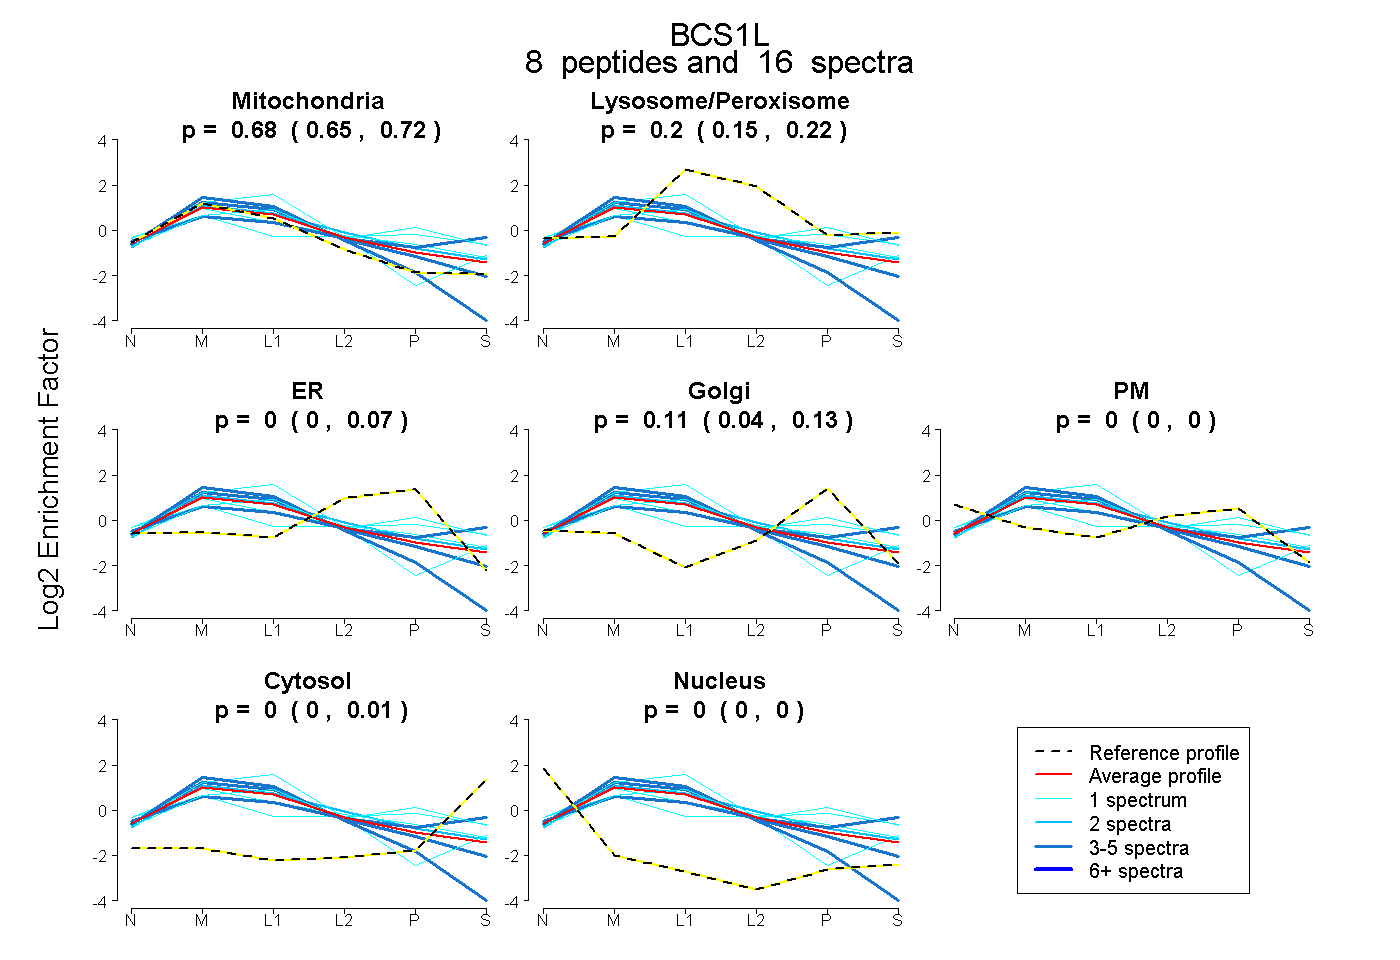
0.648 | 0.719
0.154 | 0.224
0.000 | 0.067
0.043 | 0.130
0.000 | 0.000
0.000 | 0.014
0.000 | 0.000
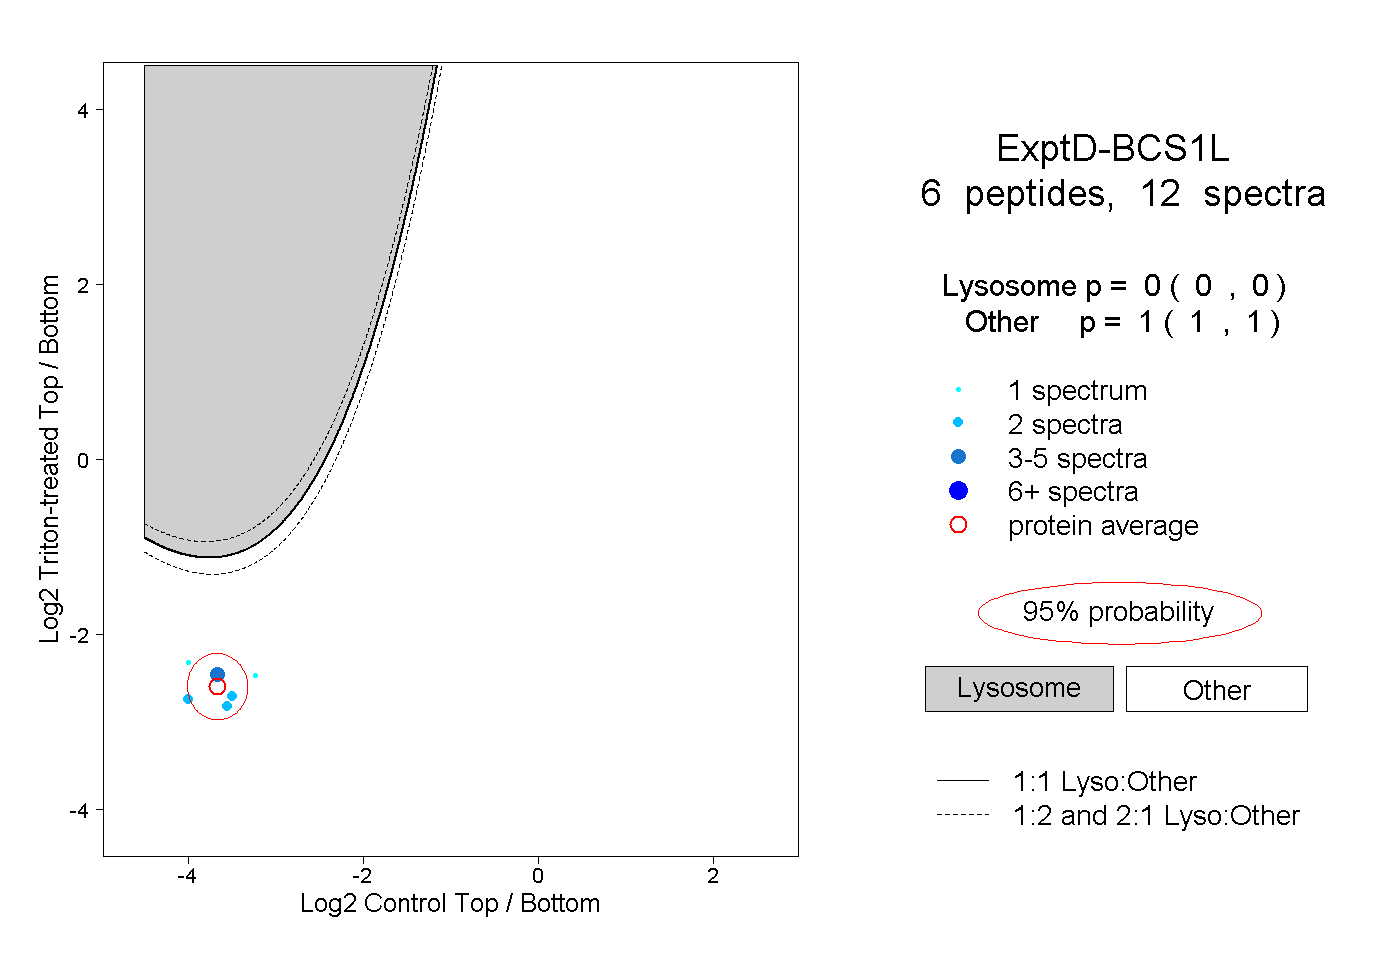
16peptides
spectra
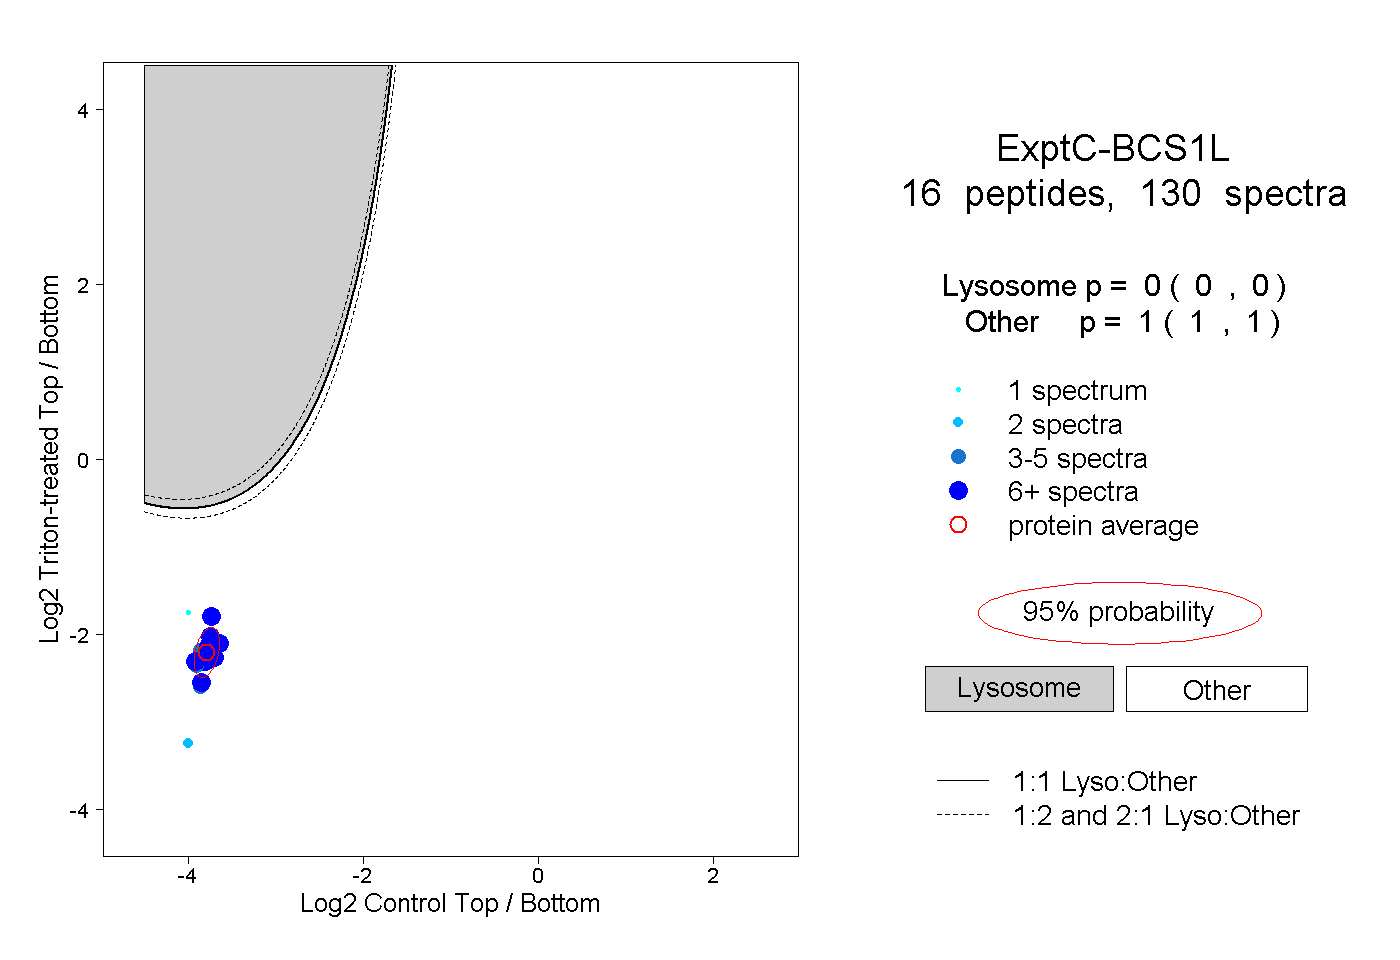
0.000 | 0.000
1.000 | 1.000