 13
13peptides
spectra
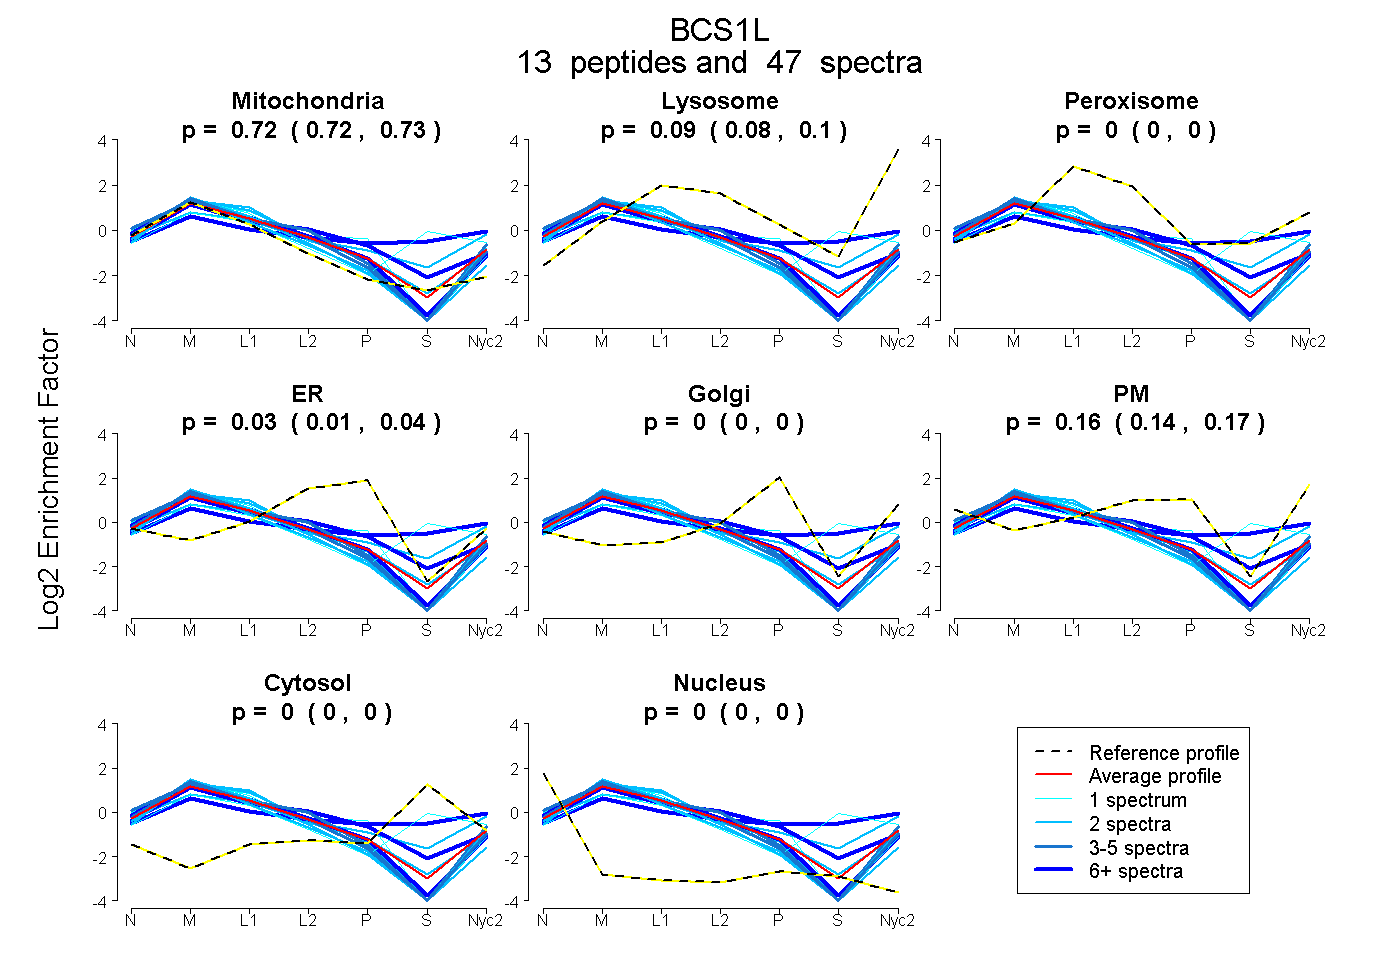
0.719 | 0.730
0.081 | 0.102
0.000 | 0.000
0.013 | 0.037
0.000 | 0.000
0.139 | 0.171
0.000 | 0.000
0.000 | 0.000
| Plot | Mito | Lyso | Perox | ER | Golgi | PM | Cytosol | Nucleus | |||||
| Expt A |
13 peptides |
47 spectra |
|
0.725 0.719 | 0.730 |
0.093 0.081 | 0.102 |
0.000 0.000 | 0.000 |
0.026 0.013 | 0.037 |
0.000 0.000 | 0.000 |
0.157 0.139 | 0.171 |
0.000 0.000 | 0.000 |
0.000 0.000 | 0.000 |
| 4 spectra, VFFNILEEAR | 0.790 | 0.012 | 0.000 | 0.000 | 0.000 | 0.198 | 0.000 | 0.000 | ||
| 2 spectra, TFGYPR | 0.824 | 0.056 | 0.000 | 0.000 | 0.000 | 0.119 | 0.000 | 0.000 | ||
| 6 spectra, HYMITLEVPAR | 0.354 | 0.196 | 0.084 | 0.000 | 0.065 | 0.046 | 0.255 | 0.000 | ||
| 2 spectra, FYPGQAPSLAENFAEHVLK | 0.770 | 0.019 | 0.000 | 0.059 | 0.000 | 0.152 | 0.000 | 0.000 | ||
| 9 spectra, LDPALIRPGR | 0.749 | 0.000 | 0.000 | 0.072 | 0.000 | 0.179 | 0.000 | 0.000 | ||
| 2 spectra, TVMYTAVGSEWR | 0.908 | 0.010 | 0.000 | 0.037 | 0.000 | 0.045 | 0.000 | 0.000 | ||
| 1 spectrum, LTFSGLLNALDGVASTEAR | 0.855 | 0.026 | 0.000 | 0.000 | 0.000 | 0.119 | 0.000 | 0.000 | ||
| 2 spectra, GAQLGLVAFR | 0.546 | 0.187 | 0.009 | 0.000 | 0.000 | 0.164 | 0.094 | 0.000 | ||
| 3 spectra, NDPMGAIHNVESLR | 0.702 | 0.000 | 0.000 | 0.000 | 0.000 | 0.298 | 0.000 | 0.000 | ||
| 1 spectrum, ALALQQEEGK | 0.585 | 0.000 | 0.000 | 0.098 | 0.000 | 0.317 | 0.000 | 0.000 | ||
| 12 spectra, IVFMTTNHIDR | 0.609 | 0.088 | 0.072 | 0.231 | 0.000 | 0.000 | 0.000 | 0.000 | ||
| 2 spectra, EYVGYCSHWQLTQMFQR | 0.758 | 0.156 | 0.018 | 0.067 | 0.000 | 0.000 | 0.000 | 0.000 | ||
| 1 spectrum, RPLDSVVLQQGLADR | 0.450 | 0.053 | 0.191 | 0.000 | 0.000 | 0.000 | 0.306 | 0.000 |
| Plot | Mito | Lyso or Perox | ER | Golgi | PM | Cytosol | Nucleus | ||||||
| Expt B |
8 peptides |
16 spectra |
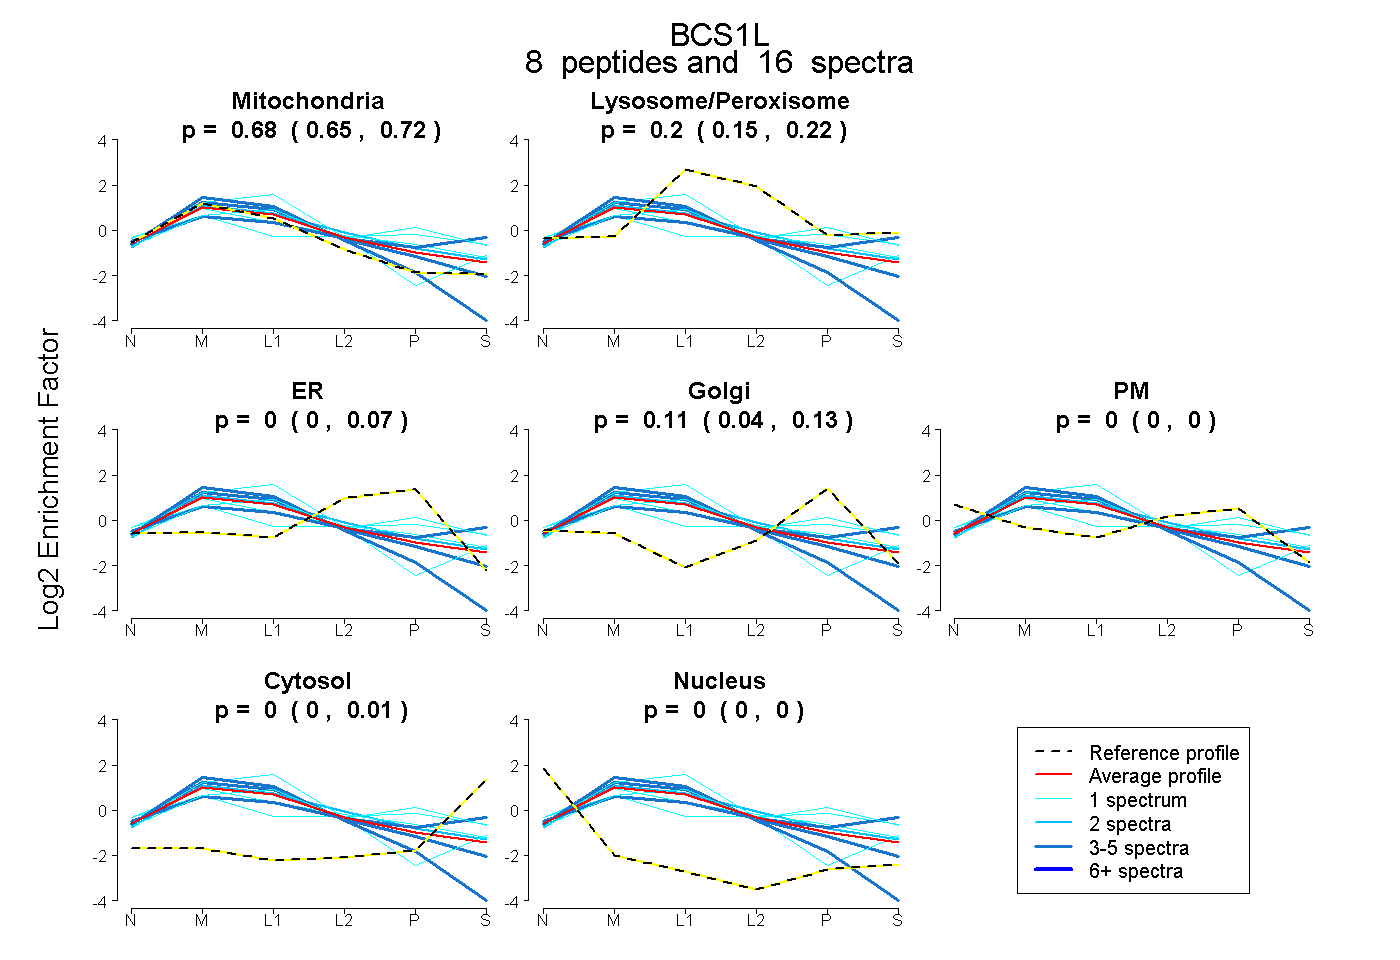 |
0.684 0.648 | 0.719 |
0.204 0.154 | 0.224 |
0.000 0.000 | 0.067 |
0.112 0.043 | 0.130 |
0.000 0.000 | 0.000 |
0.000 0.000 | 0.014 |
0.000 0.000 | 0.000 |
|||
| Plot | Lyso | Other | |||||||||||
| Expt C |
16 peptides |
130 spectra |
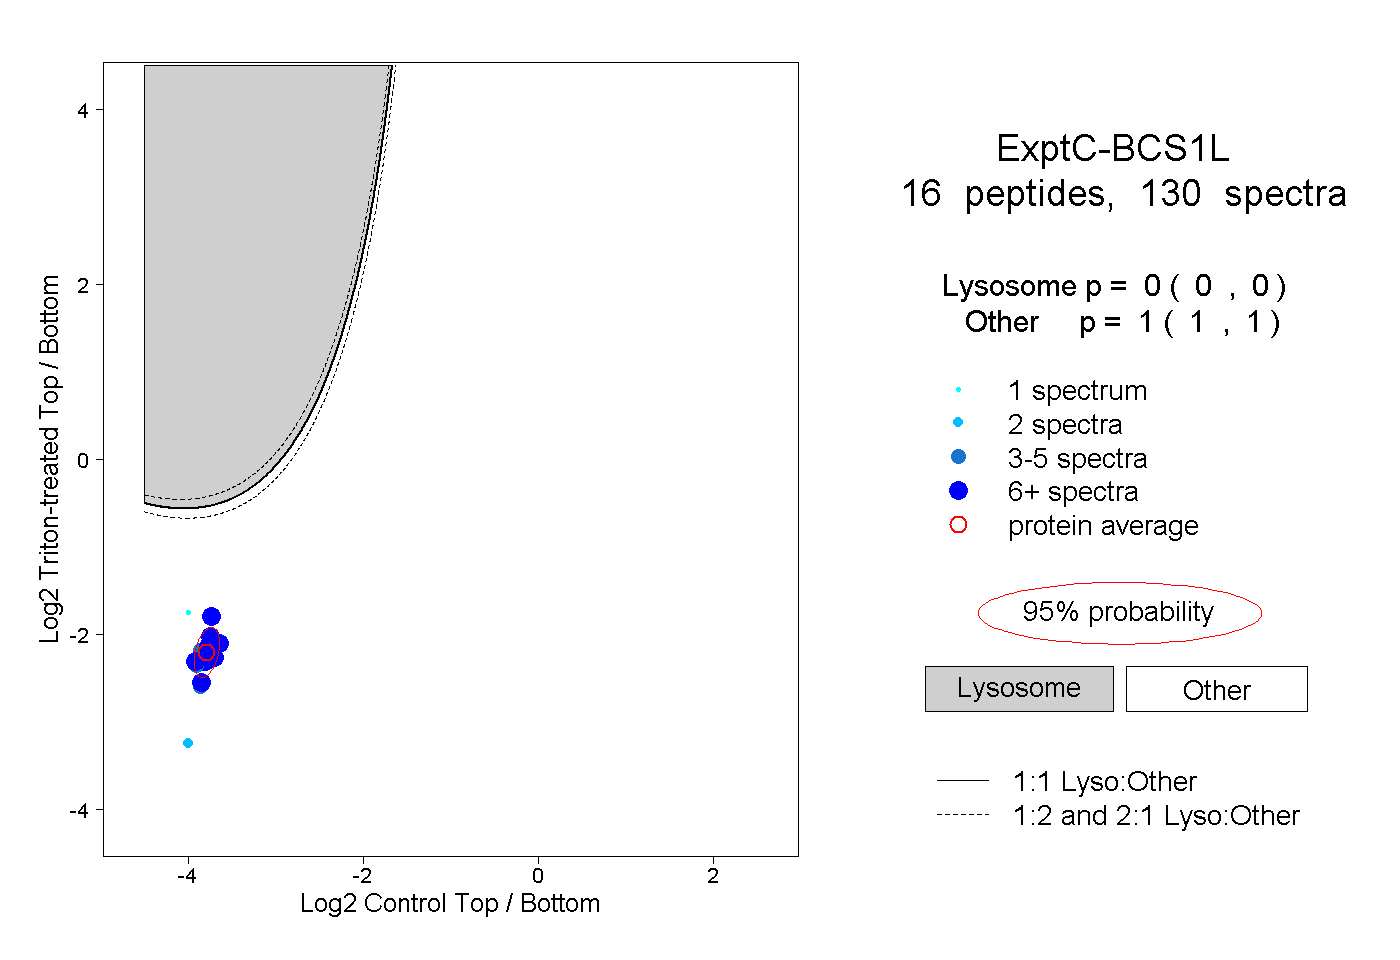 |
0.000 0.000 | 0.000 |
1.000 1.000 | 1.000 |
||||||||
| Plot | Lyso | Other | |||||||||||
| Expt D |
6 peptides |
12 spectra |
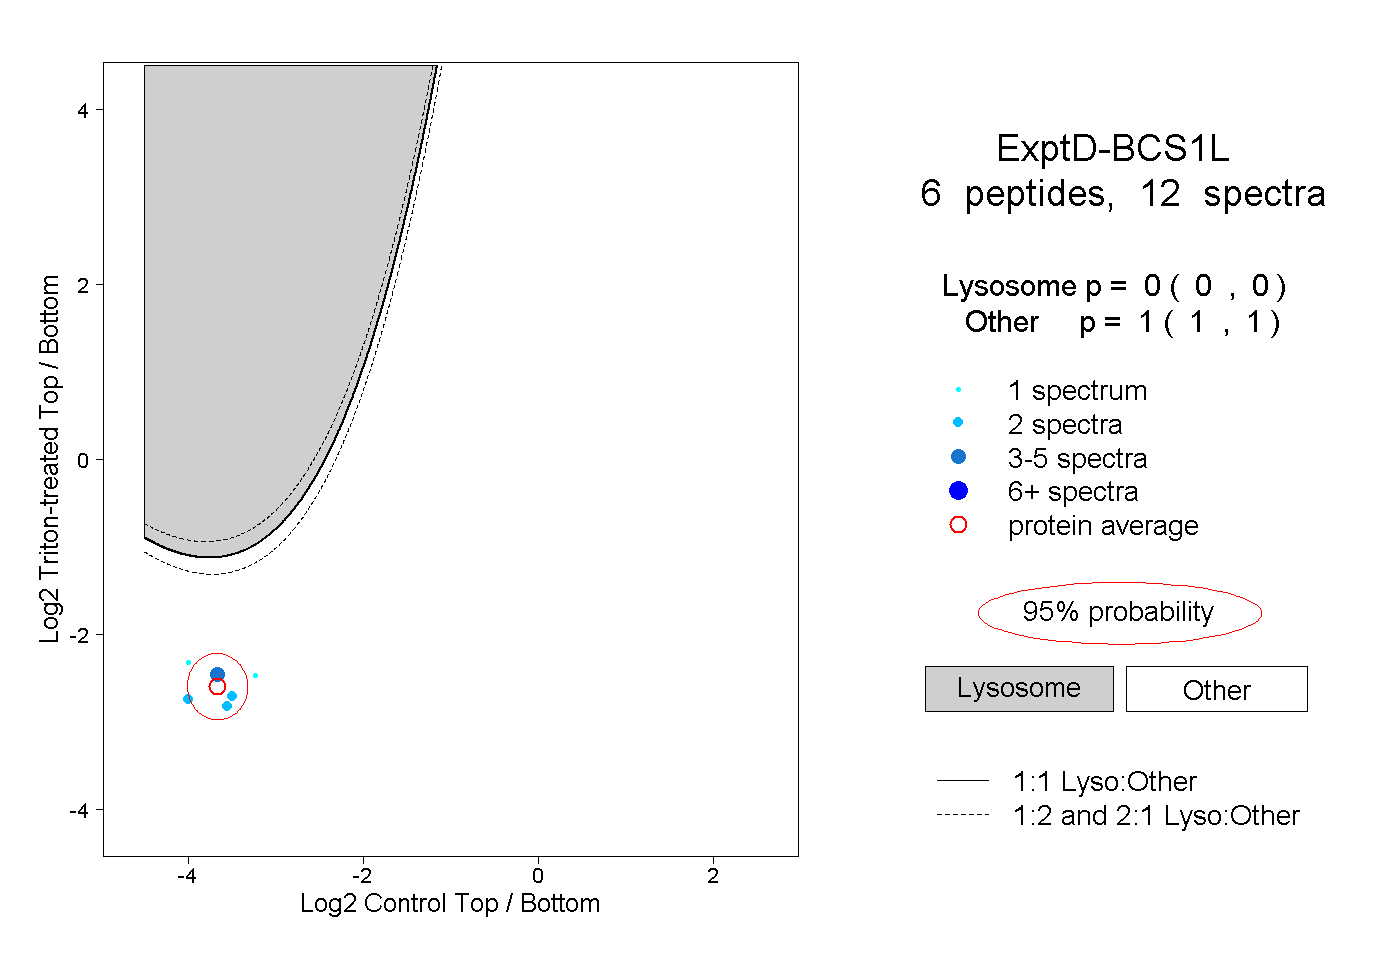 |
0.000 0.000 | 0.000 |
1.000 1.000 | 1.000 |