 25
25peptides
spectra
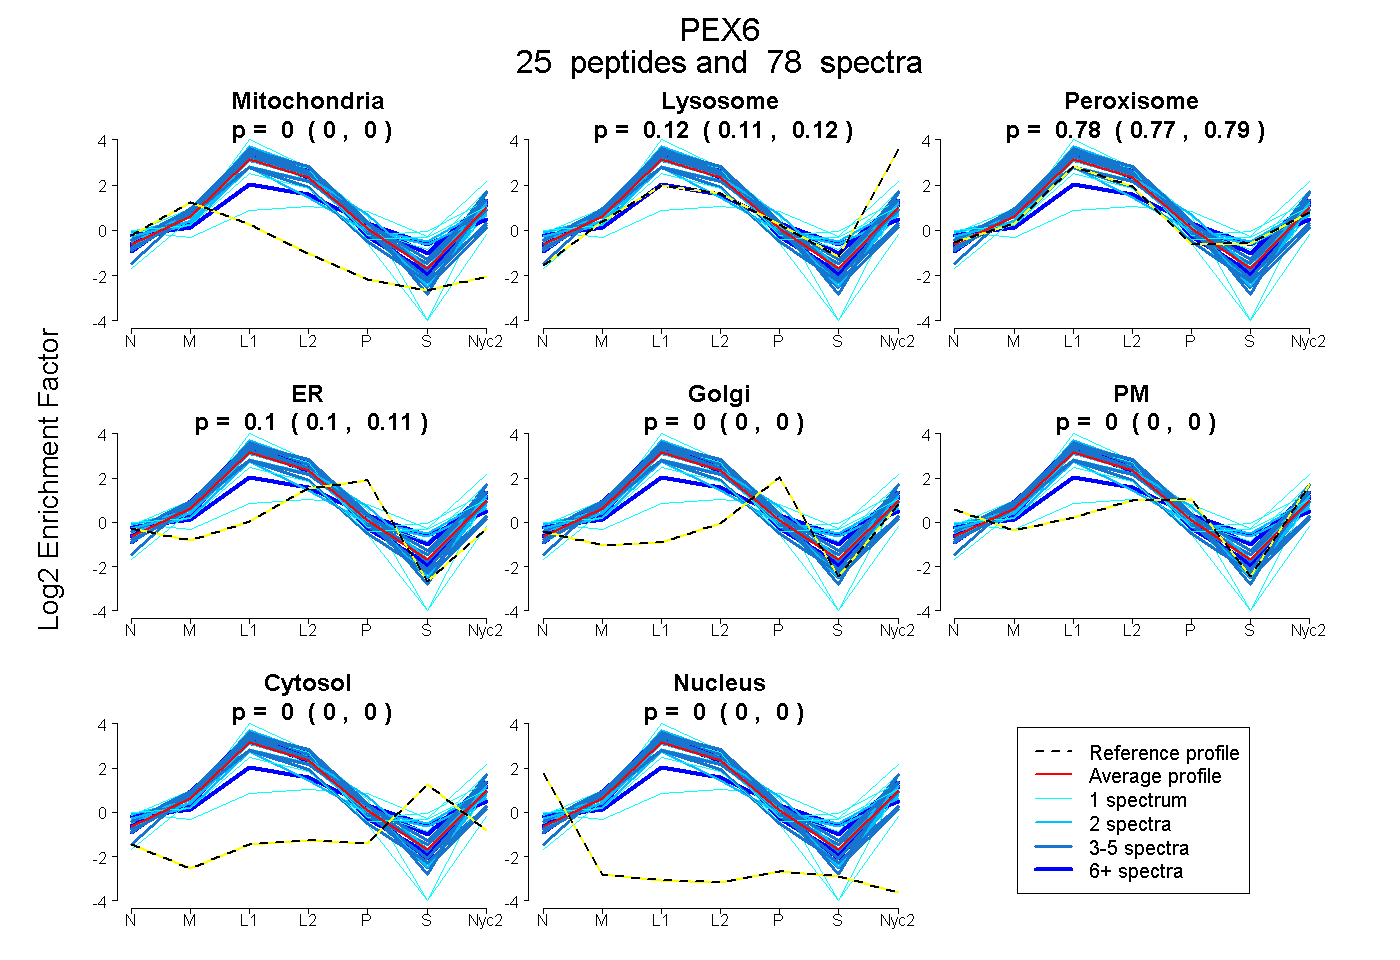
0.000 | 0.000
0.110 | 0.124
0.771 | 0.787
0.097 | 0.107
0.000 | 0.000
0.000 | 0.000
0.000 | 0.000
0.000 | 0.000
16peptides
spectra
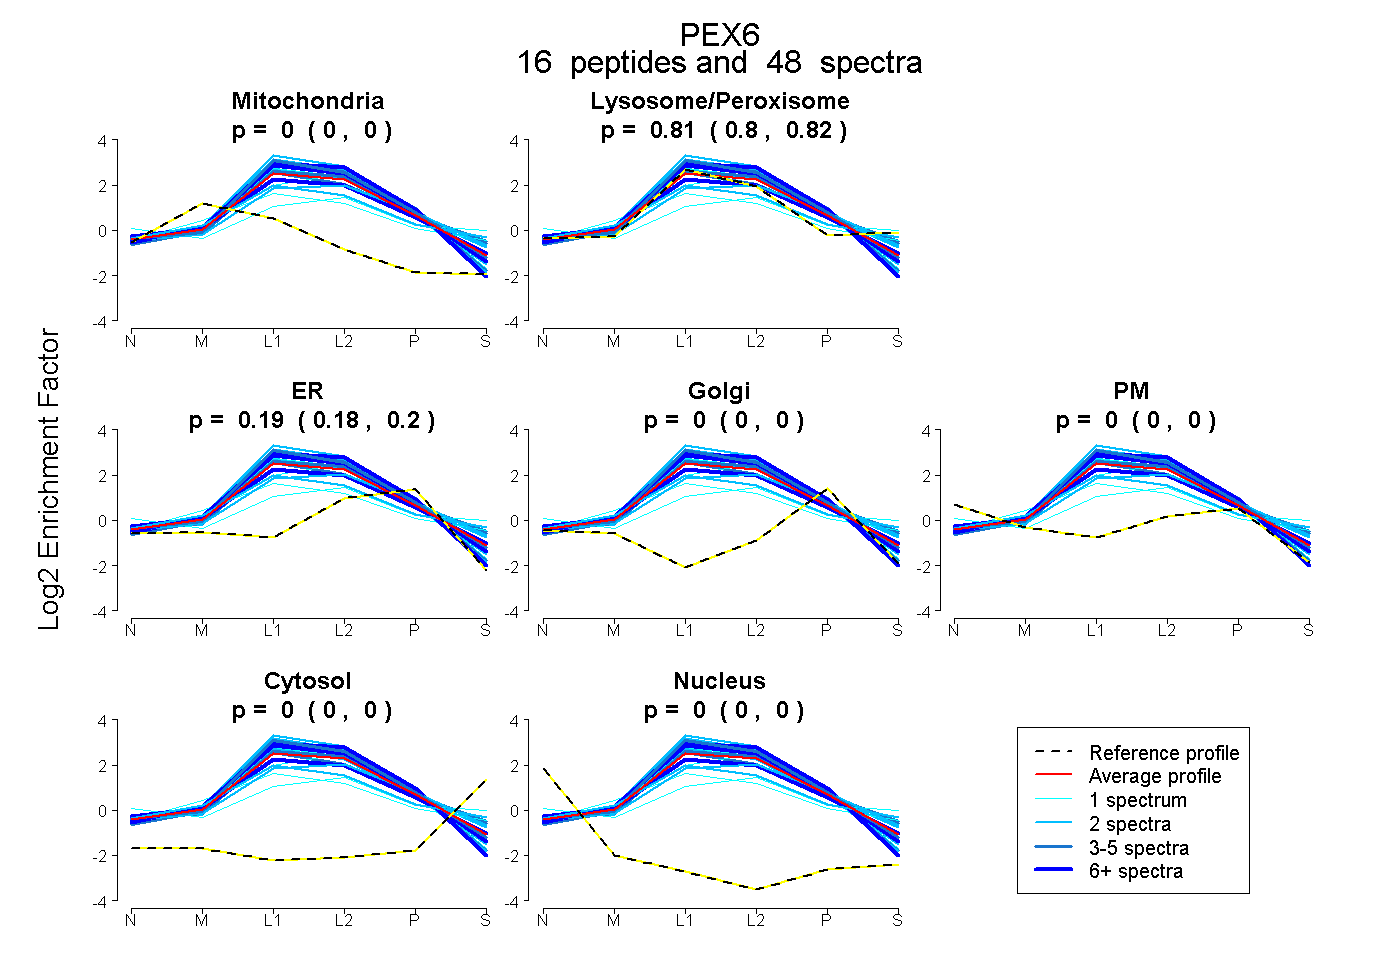
0.000 | 0.000
0.802 | 0.819
0.180 | 0.196
0.000 | 0.000
0.000 | 0.000
0.000 | 0.000
0.000 | 0.000
31peptides
spectra
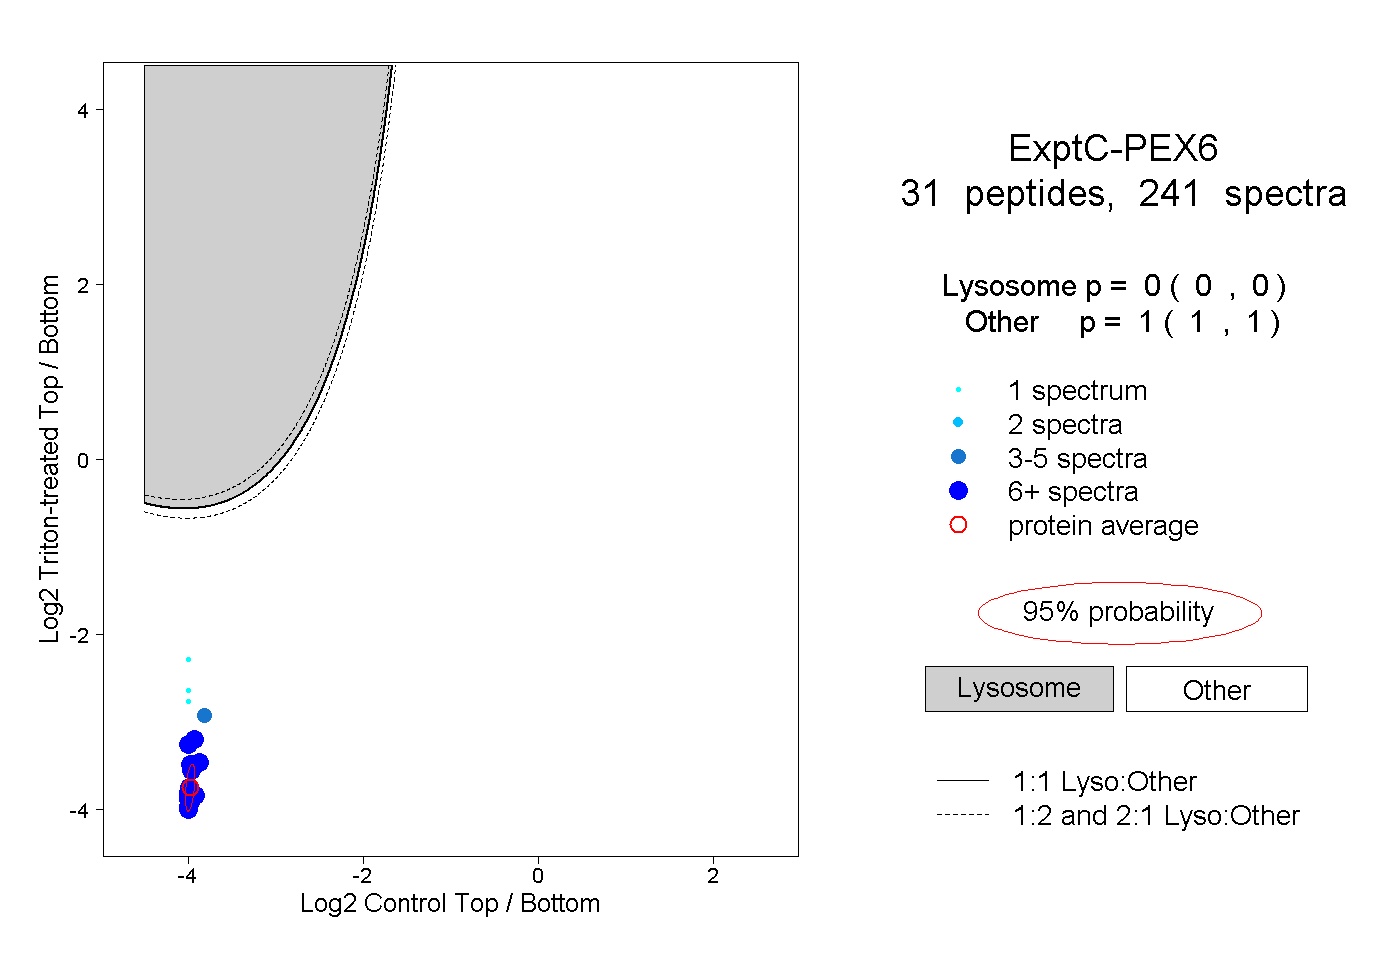
0.000 | 0.000
1.000 | 1.000
13peptides
spectra
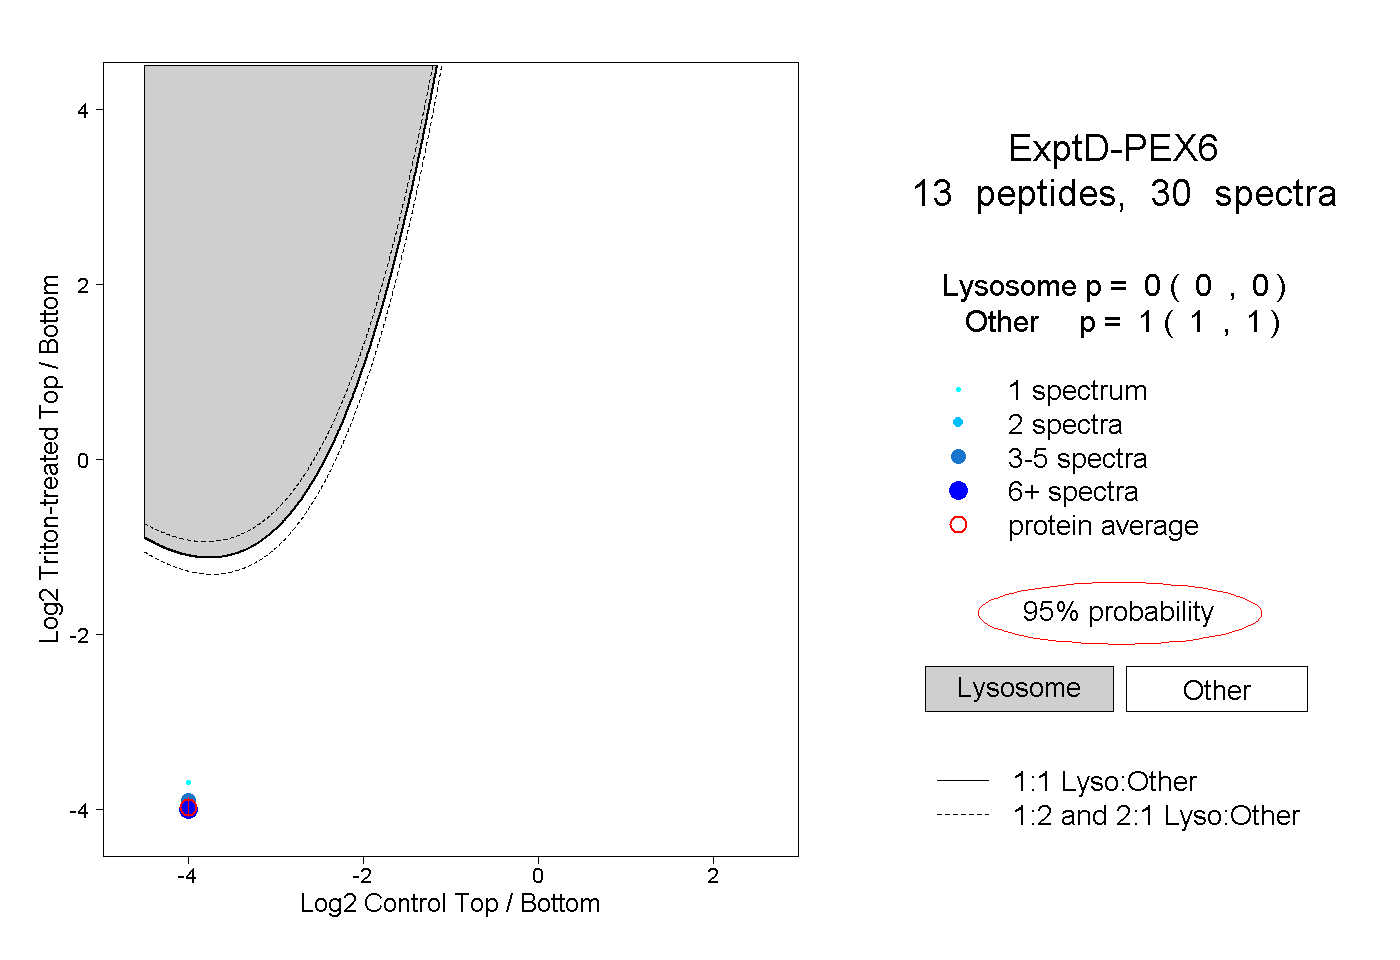
0.000 | 0.000
1.000 | 1.000