8
8peptides
spectra
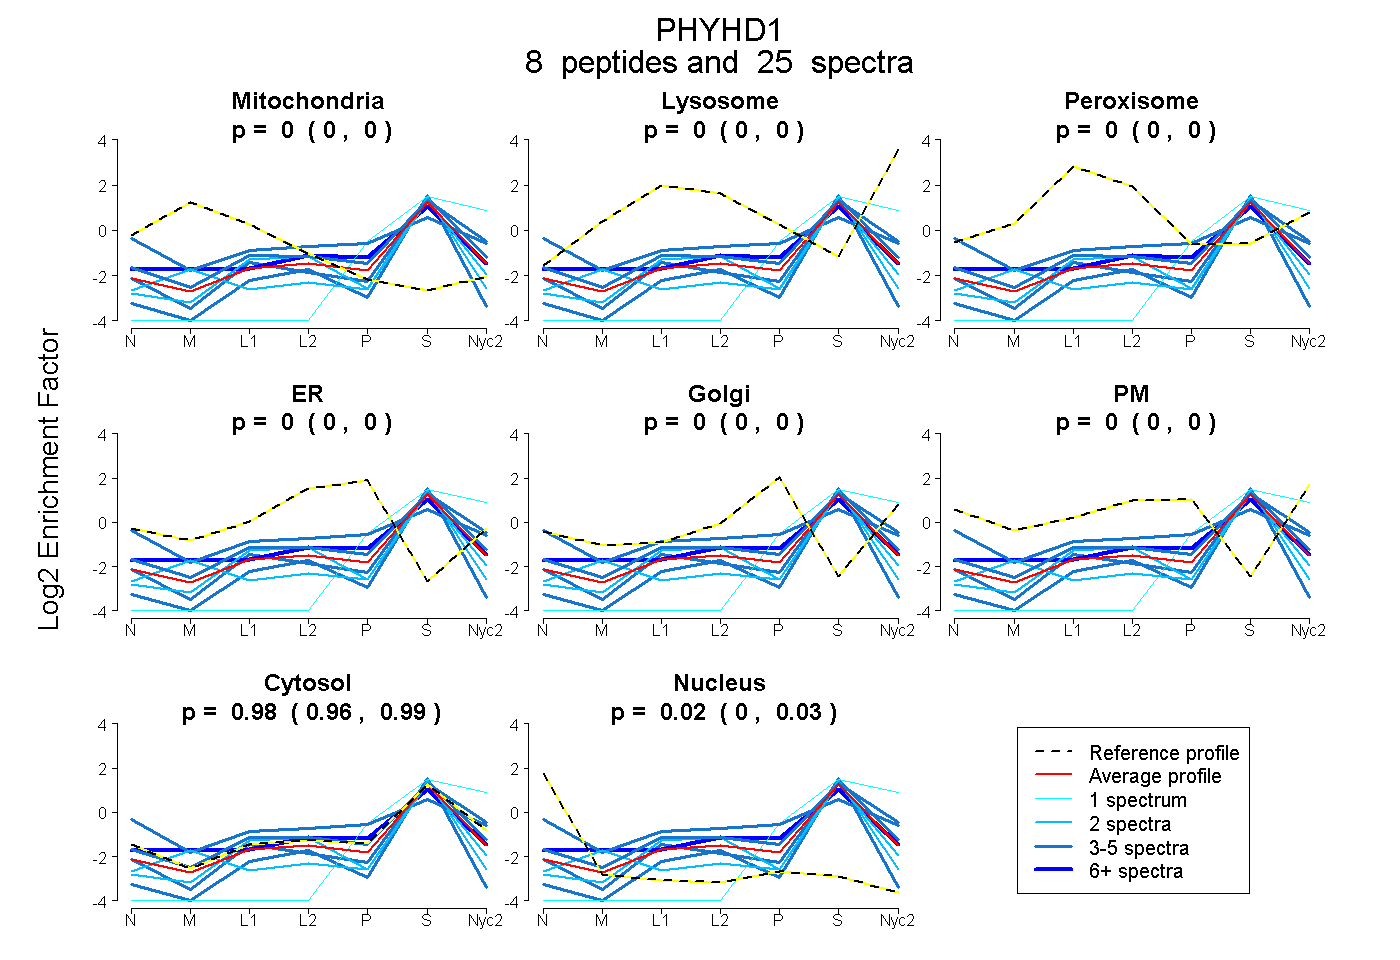
0.000 | 0.000
0.000 | 0.000
0.000 | 0.000
0.000 | 0.000
0.000 | 0.000
0.000 | 0.000
0.964 | 0.994
0.003 | 0.034
5peptides
spectra
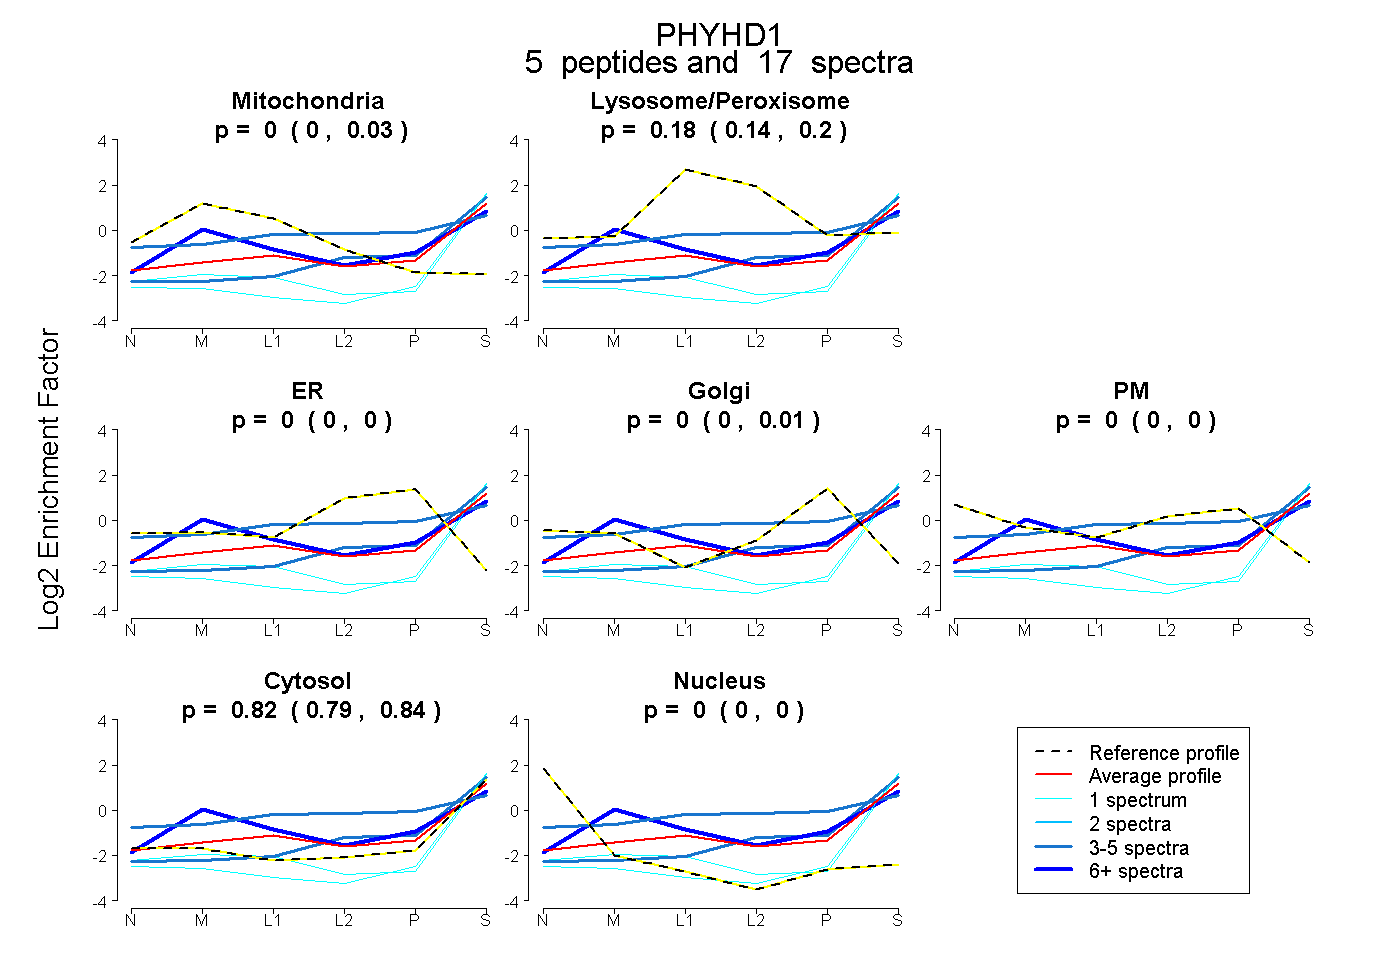
0.000 | 0.030
0.140 | 0.202
0.000 | 0.000
0.000 | 0.012
0.000 | 0.000
0.788 | 0.843
0.000 | 0.000