 8
8peptides
spectra
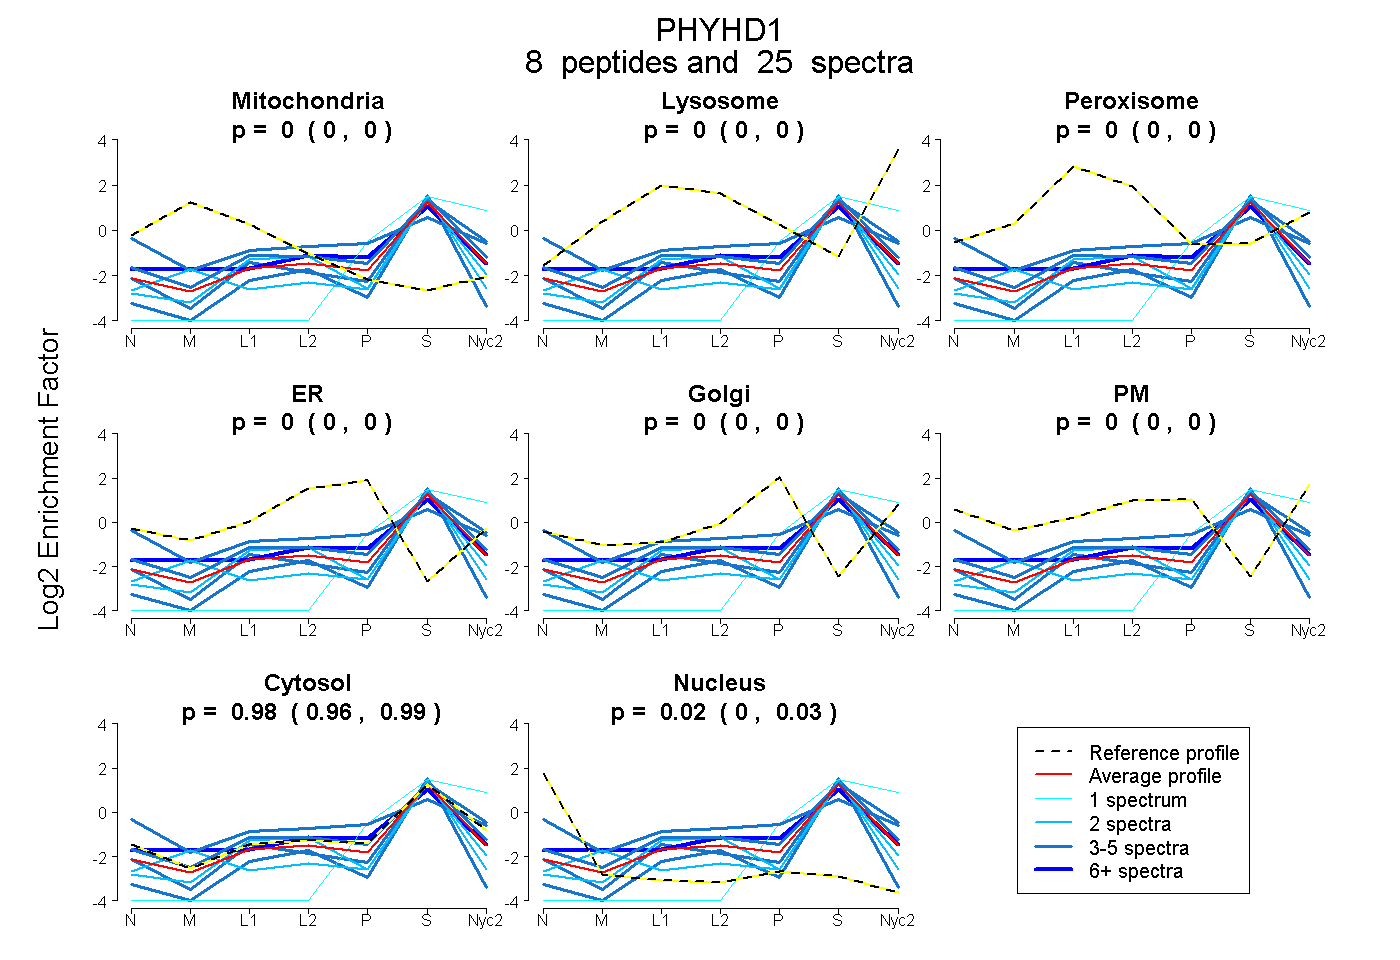
0.000 | 0.000
0.000 | 0.000
0.000 | 0.000
0.000 | 0.000
0.000 | 0.000
0.000 | 0.000
0.964 | 0.994
0.003 | 0.034
| Plot | Mito | Lyso | Perox | ER | Golgi | PM | Cytosol | Nucleus | |||||
| Expt A |
8 peptides |
25 spectra |
|
0.000 0.000 | 0.000 |
0.000 0.000 | 0.000 |
0.000 0.000 | 0.000 |
0.000 0.000 | 0.000 |
0.000 0.000 | 0.000 |
0.000 0.000 | 0.000 |
0.980 0.964 | 0.994 |
0.020 0.003 | 0.034 |
| 4 spectra, GGLVLIHGEVVHK | 0.000 | 0.000 | 0.000 | 0.000 | 0.000 | 0.000 | 0.894 | 0.106 | ||
| 3 spectra, SEQNLSDHSR | 0.000 | 0.000 | 0.069 | 0.043 | 0.000 | 0.162 | 0.677 | 0.050 | ||
| 3 spectra, GVFDEK | 0.000 | 0.000 | 0.000 | 0.000 | 0.000 | 0.000 | 0.986 | 0.014 | ||
| 1 spectrum, QPHFGGEVSPHQDATFLYTEPLGR | 0.000 | 0.000 | 0.000 | 0.000 | 0.000 | 0.000 | 1.000 | 0.000 | ||
| 4 spectra, VQALVR | 0.000 | 0.050 | 0.000 | 0.000 | 0.000 | 0.000 | 0.950 | 0.000 | ||
| 2 spectra, IGHALHAHDPVFR | 0.000 | 0.000 | 0.000 | 0.000 | 0.000 | 0.000 | 0.980 | 0.020 | ||
| 6 spectra, IGEIVAEMDVPLHCR | 0.107 | 0.000 | 0.000 | 0.000 | 0.000 | 0.000 | 0.893 | 0.000 | ||
| 2 spectra, SLGLQIPVVVQSMYIFK | 0.000 | 0.000 | 0.000 | 0.000 | 0.000 | 0.000 | 0.904 | 0.096 |
| Plot | Mito | Lyso or Perox | ER | Golgi | PM | Cytosol | Nucleus | ||||||
| Expt B |
5 peptides |
17 spectra |
 |
0.000 0.000 | 0.030 |
0.178 0.140 | 0.202 |
0.000 0.000 | 0.000 |
0.000 0.000 | 0.012 |
0.000 0.000 | 0.000 |
0.822 0.788 | 0.843 |
0.000 0.000 | 0.000 |
|||
| Plot | Lyso | Other | |||||||||||
| Expt C |
4 peptides |
24 spectra |
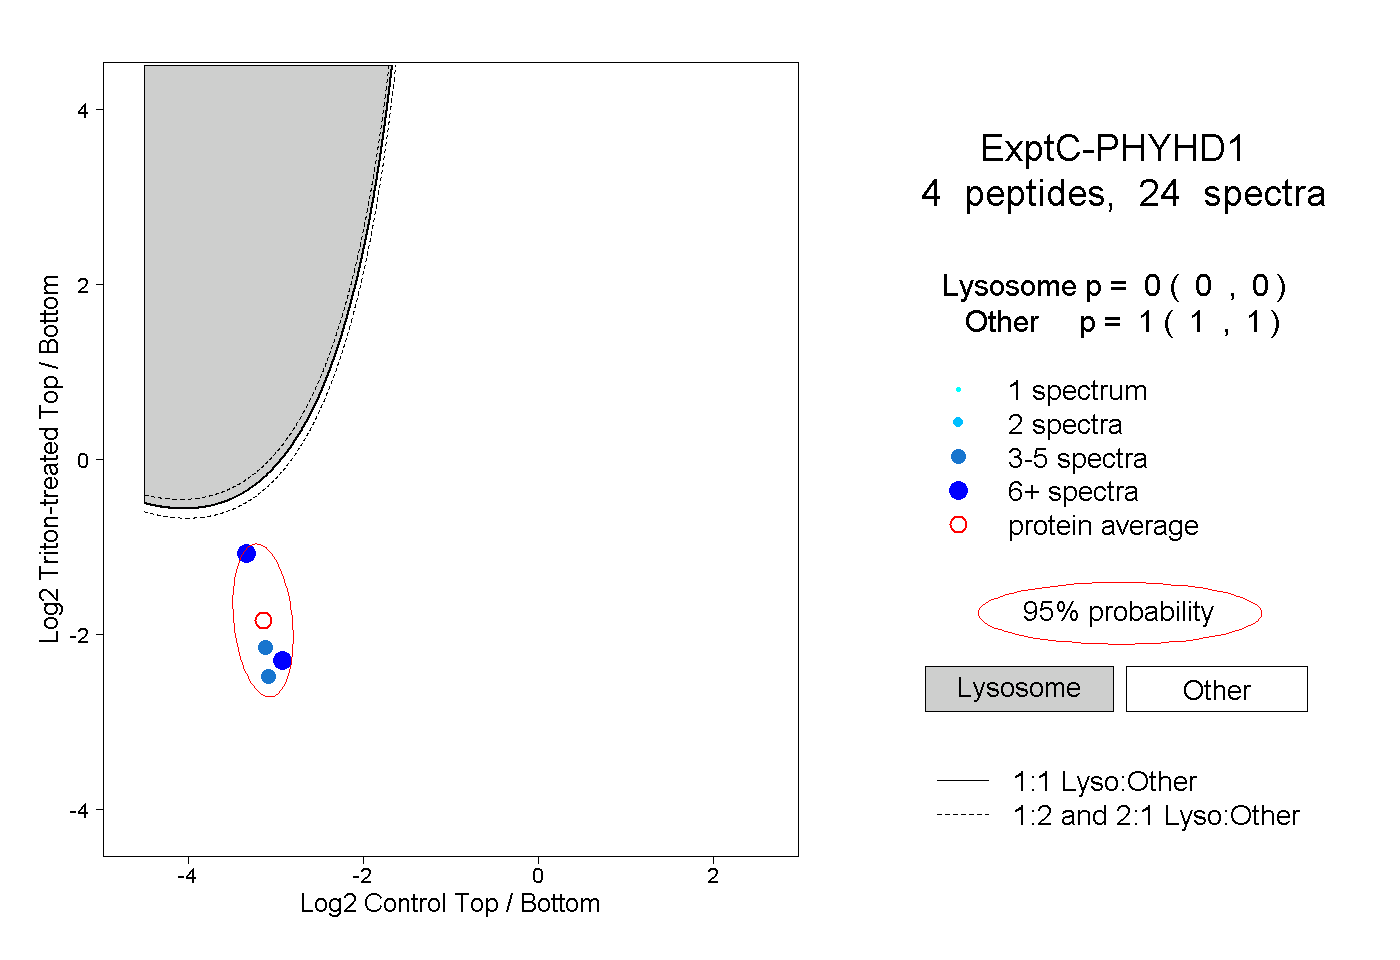 |
0.000 0.000 | 0.000 |
1.000 1.000 | 1.000 |
||||||||
| Plot | Lyso | Other | |||||||||||
| Expt D |
3 peptides |
4 spectra |
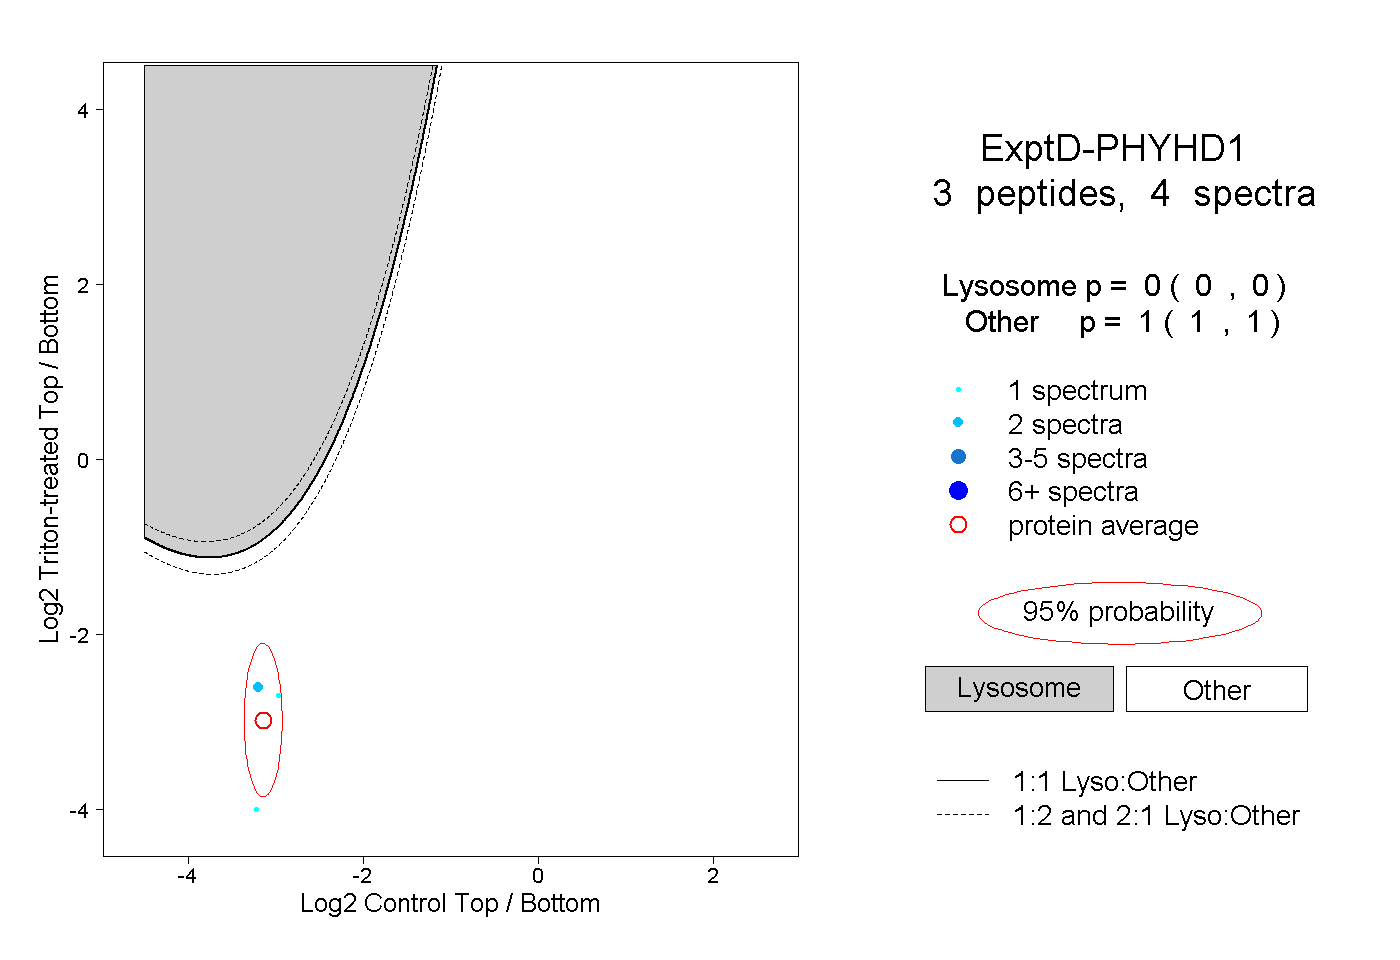 |
0.000 0.000 | 0.000 |
1.000 1.000 | 1.000 |