 11
11peptides
spectra
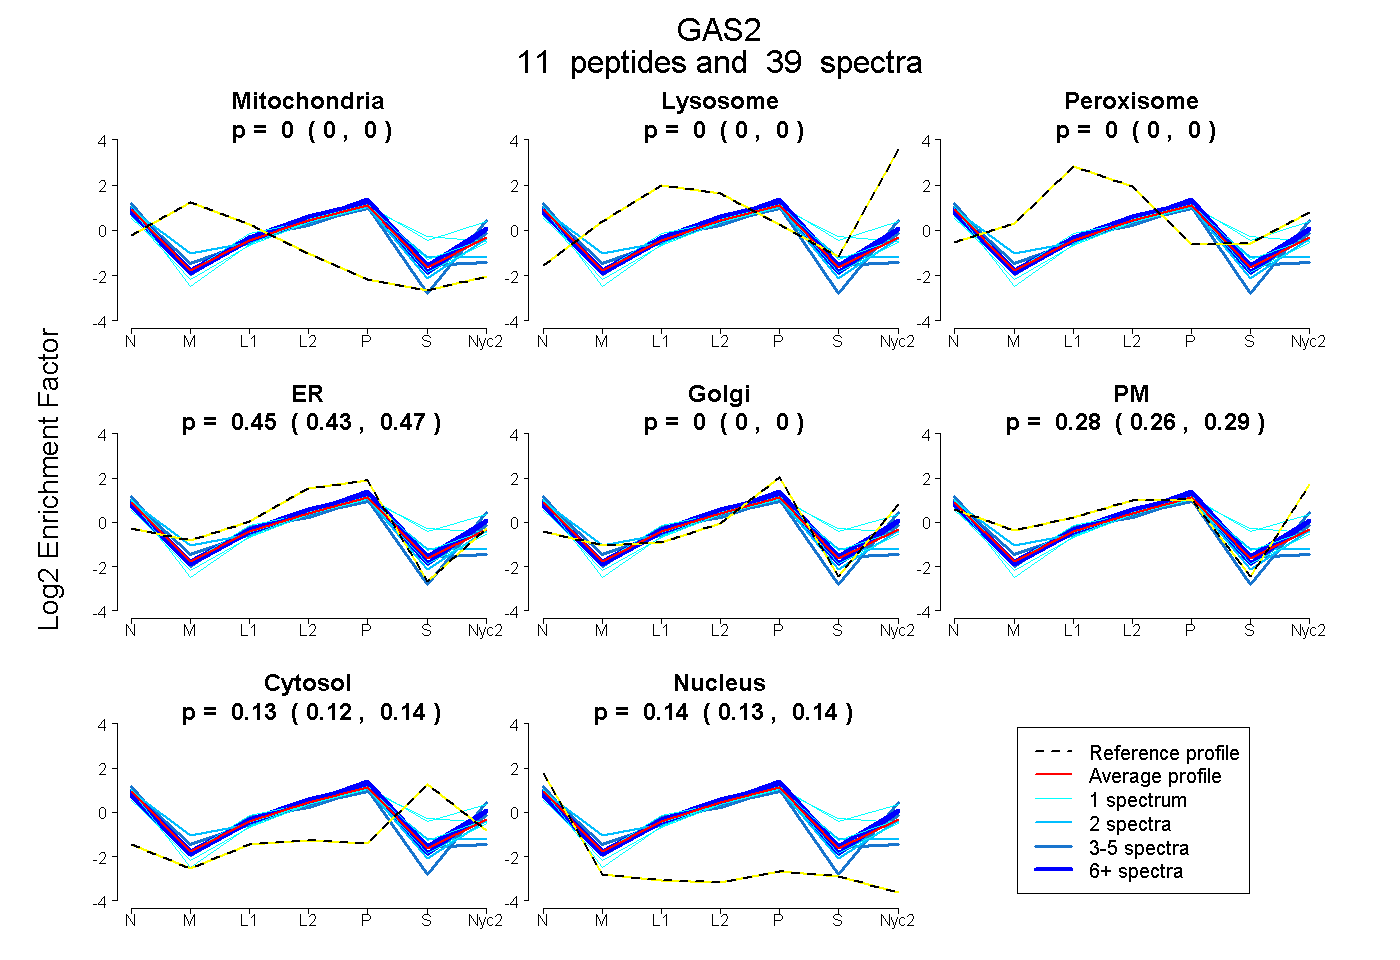
0.000 | 0.000
0.000 | 0.000
0.000 | 0.000
0.435 | 0.468
0.000 | 0.000
0.259 | 0.294
0.119 | 0.138
0.133 | 0.145
7peptides
spectra

0.000 | 0.000
0.000 | 0.000
0.000 | 0.000
0.025 | 0.120
0.744 | 0.819
0.065 | 0.133
0.011 | 0.056
11peptides
spectra
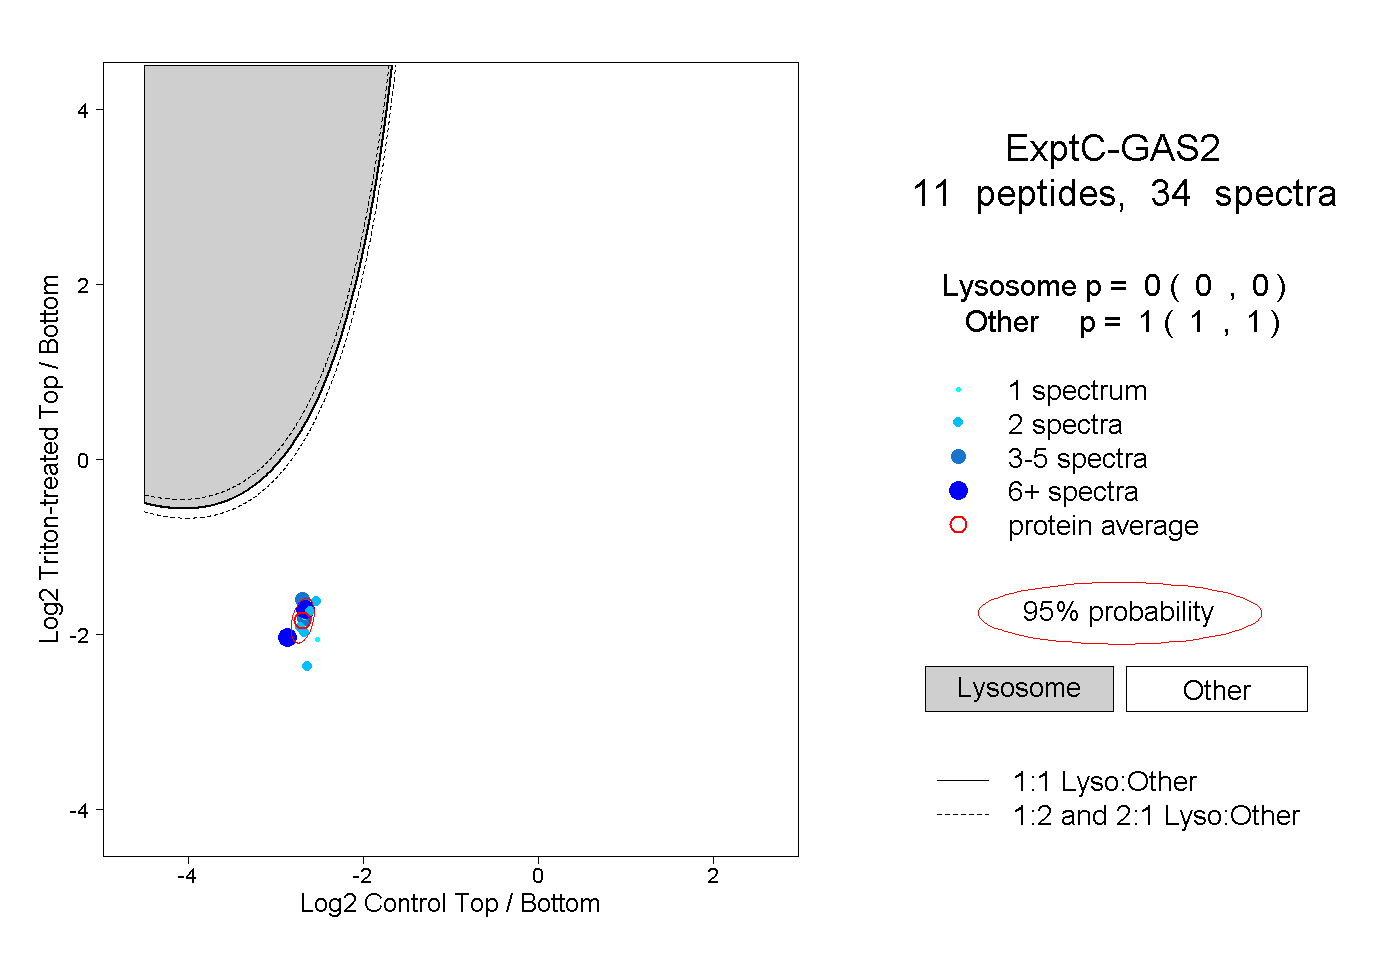
0.000 | 0.000
1.000 | 1.000
2peptides
spectra
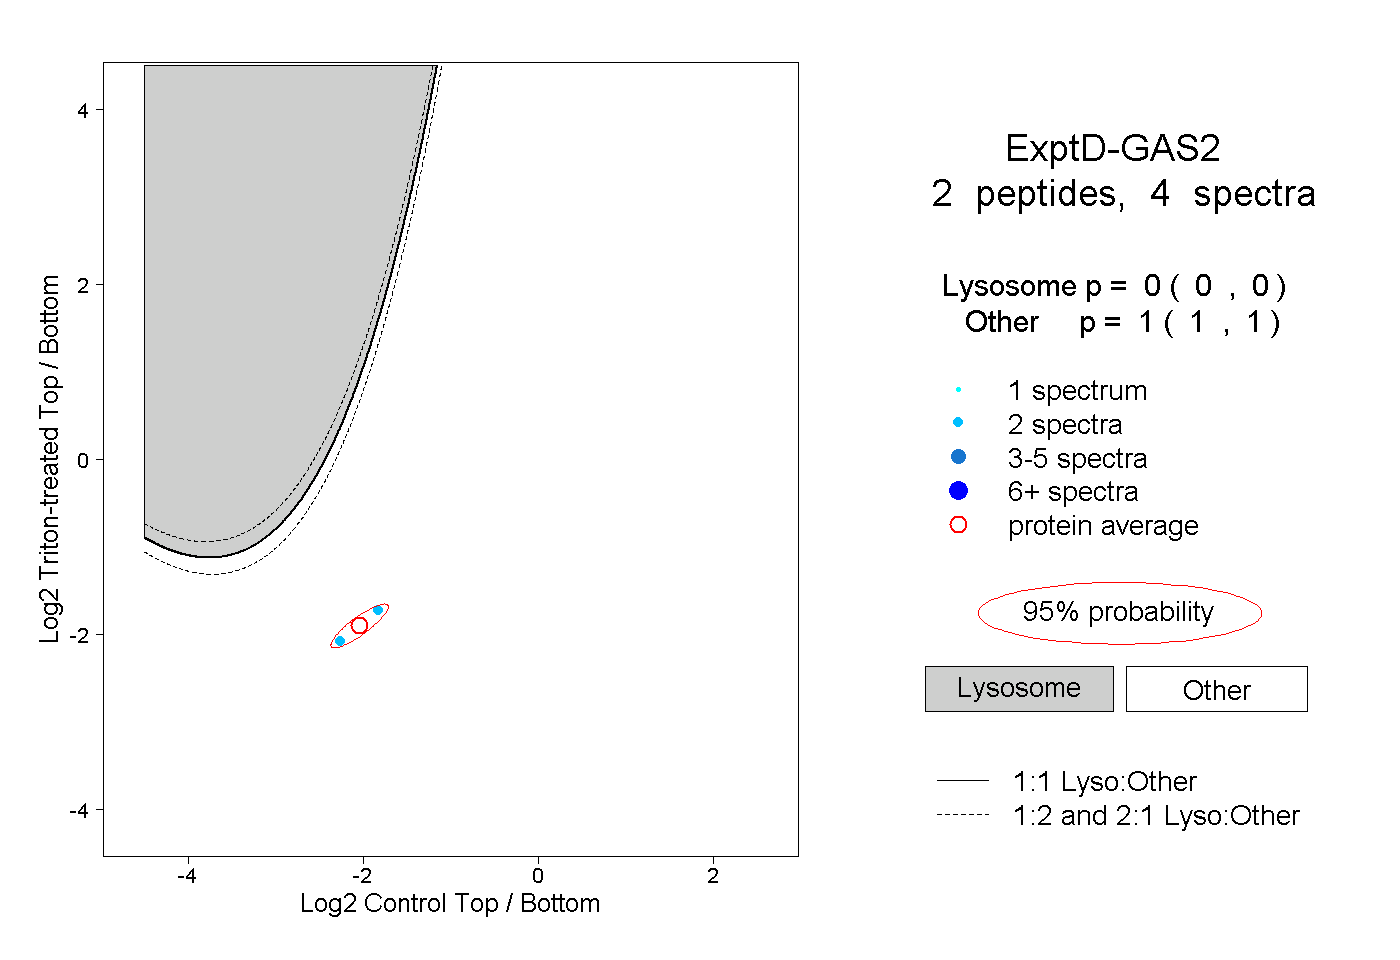
0.000 | 0.000
1.000 | 1.000