 2
2peptides
spectra
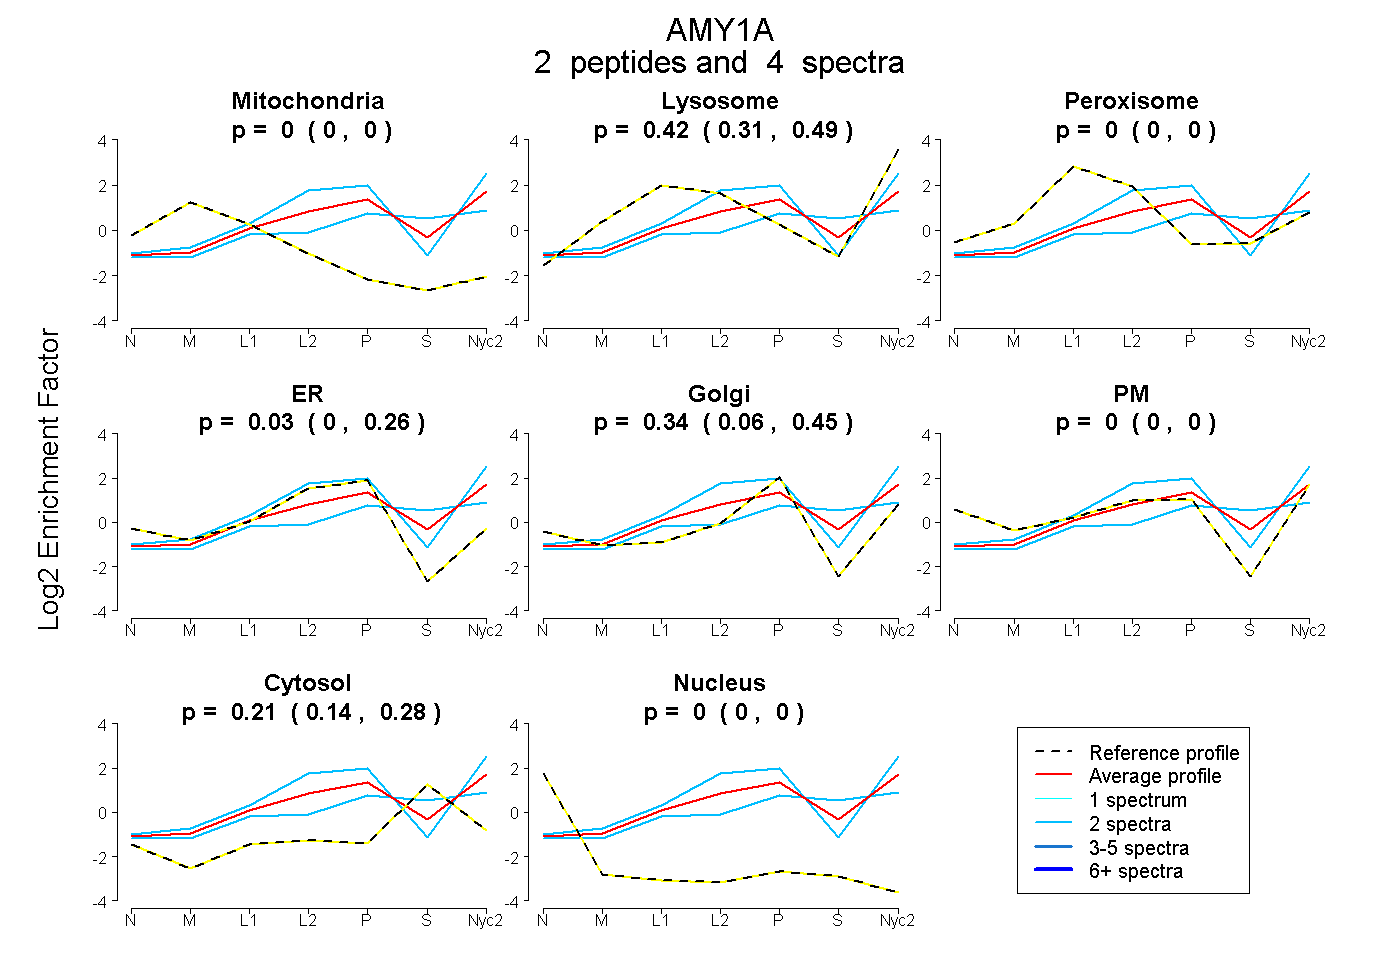
0.000 | 0.000
0.313 | 0.489
0.000 | 0.000
0.000 | 0.257
0.057 | 0.448
0.000 | 0.000
0.135 | 0.282
0.000 | 0.000
2peptides
spectra
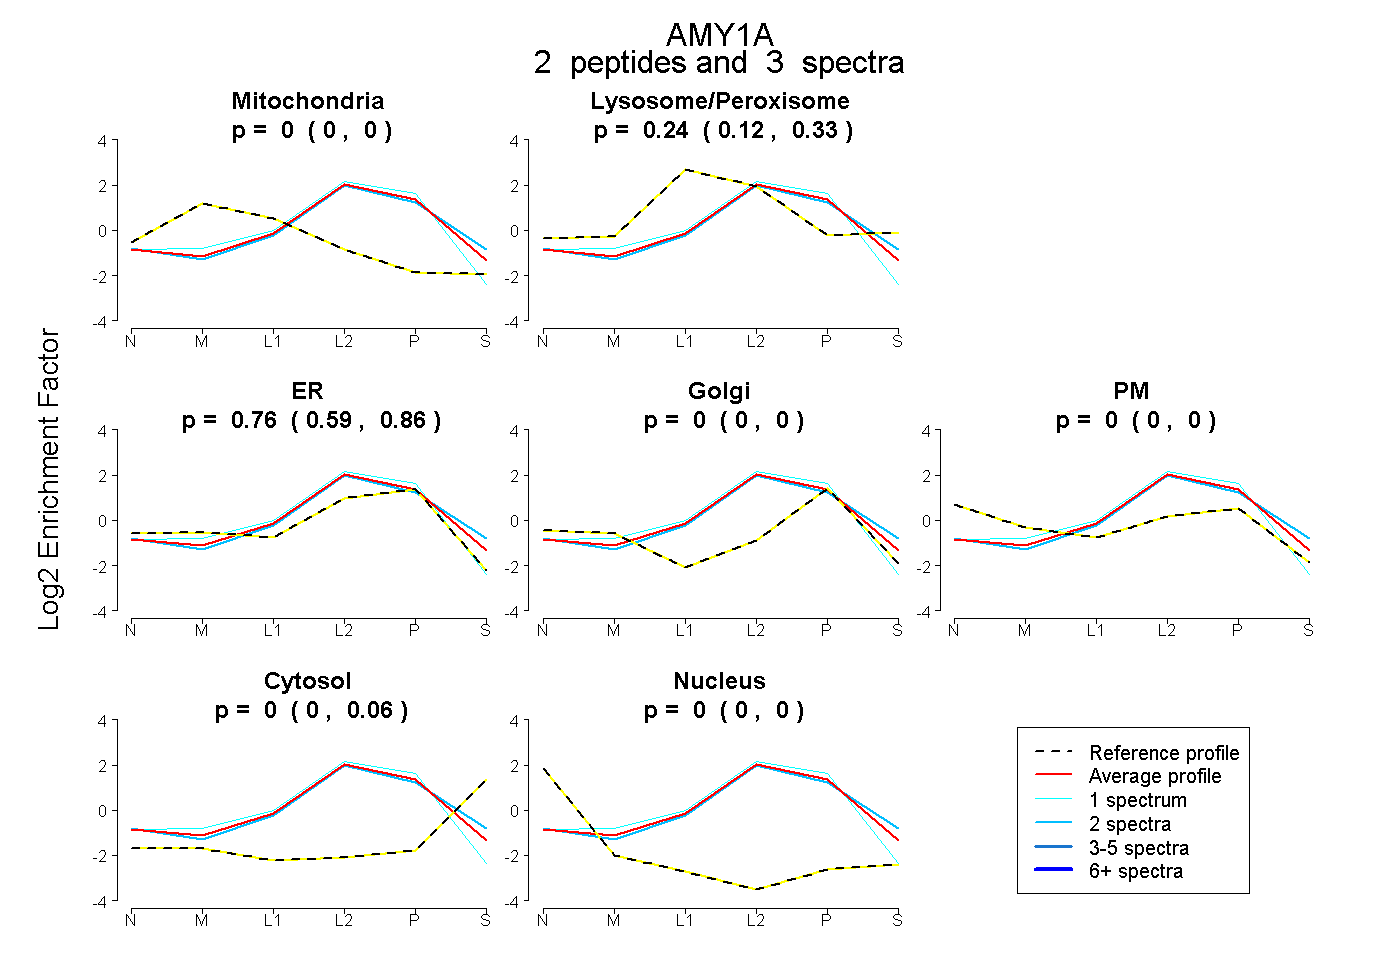
0.000 | 0.000
0.122 | 0.332
0.587 | 0.860
0.000 | 0.000
0.000 | 0.000
0.000 | 0.055
0.000 | 0.000
4peptides
spectra
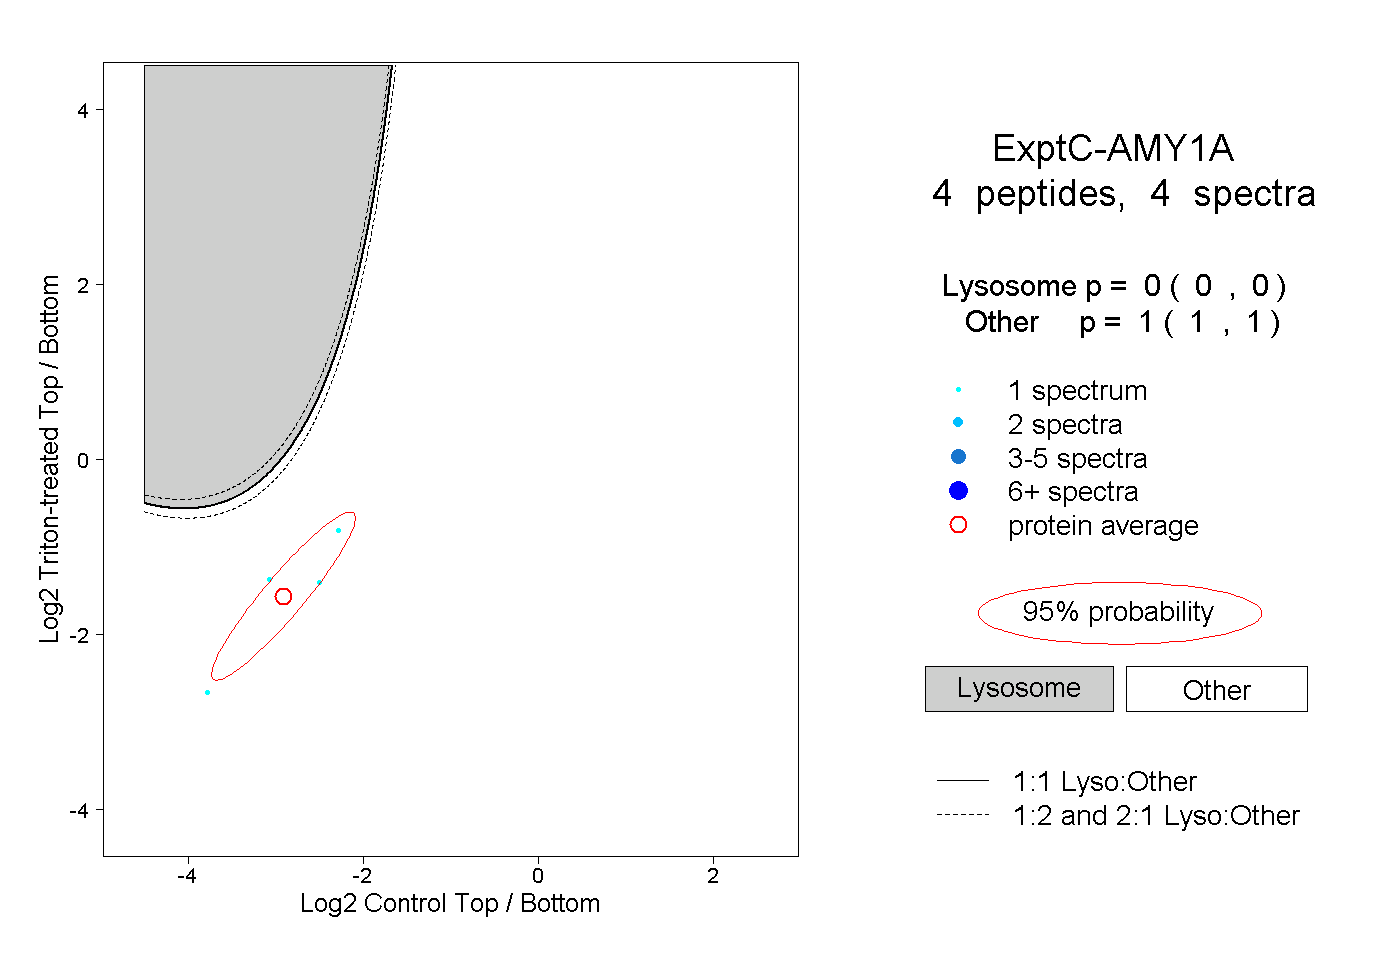
0.000 | 0.000
1.000 | 1.000
2peptides
spectra
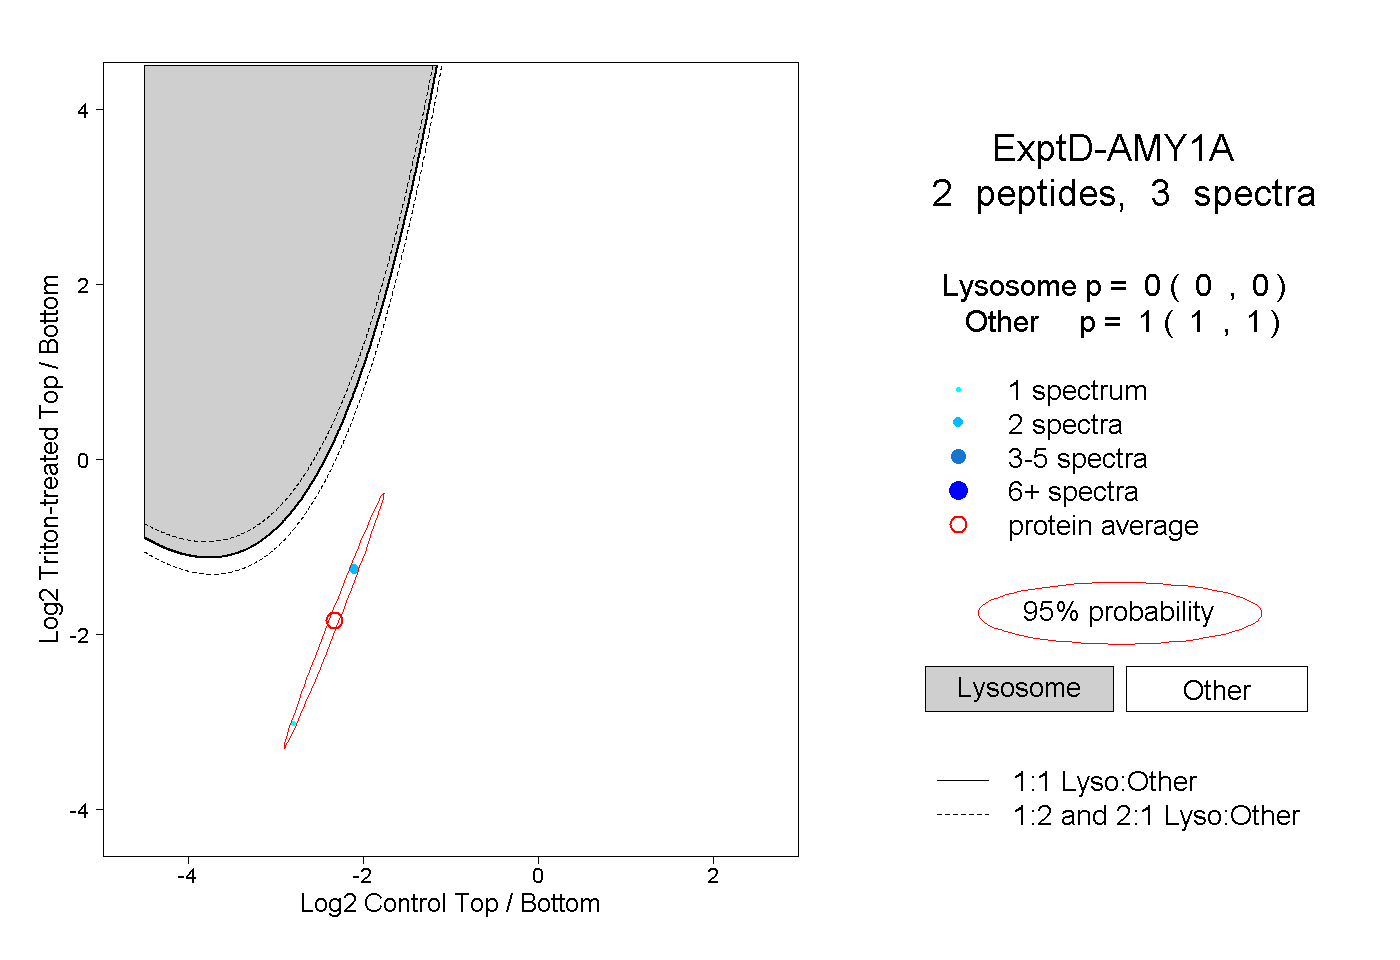
0.000 | 0.000
1.000 | 1.000