 3
3peptides
spectra
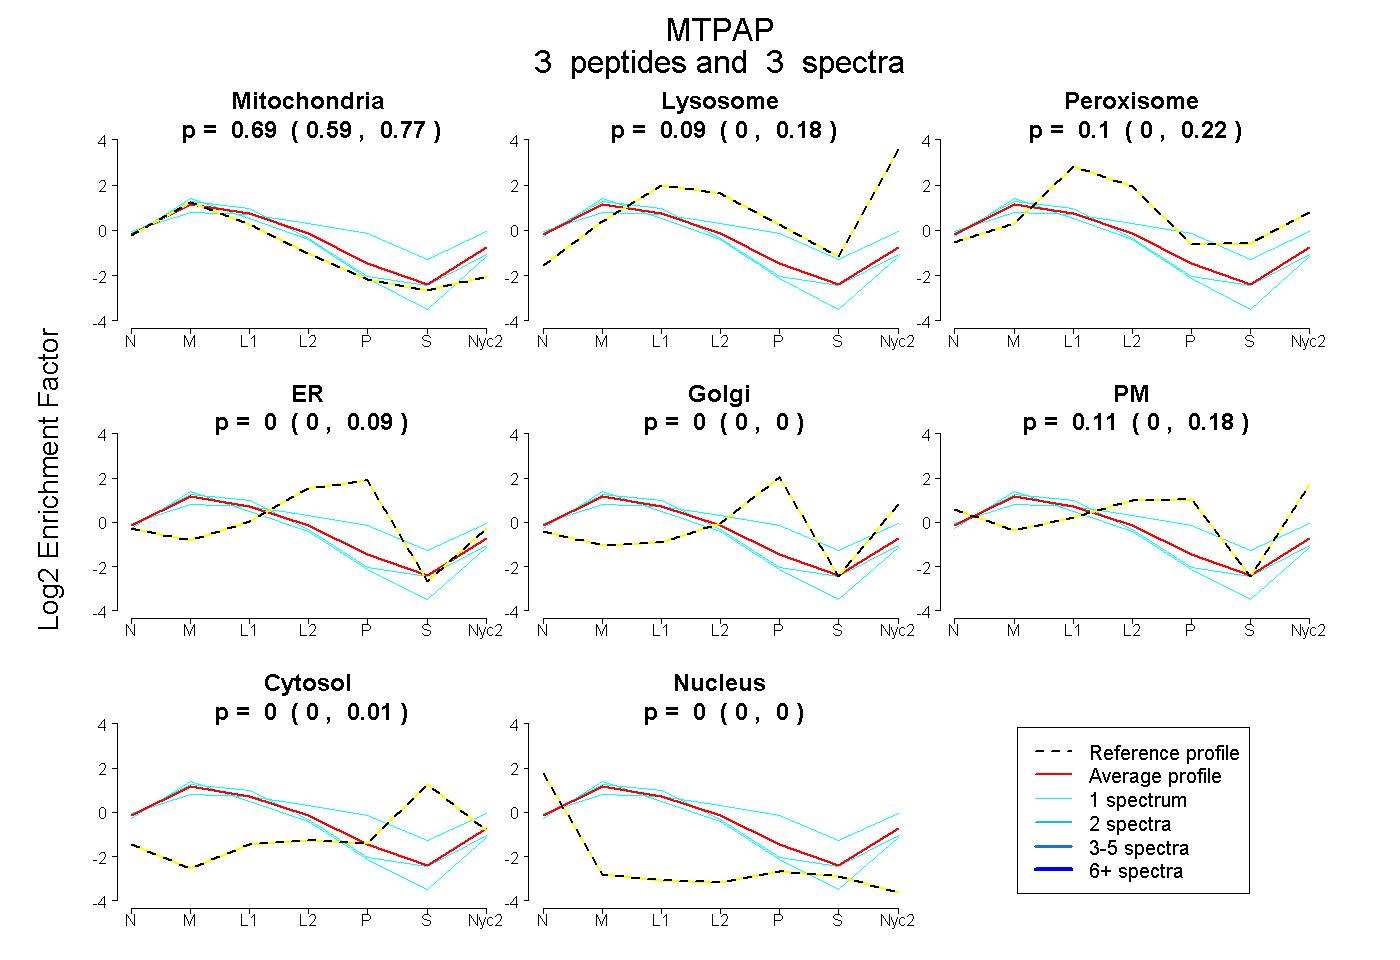
0.592 | 0.767
0.000 | 0.182
0.000 | 0.222
0.000 | 0.085
0.000 | 0.000
0.000 | 0.180
0.000 | 0.013
0.000 | 0.000
1peptide
spectrum
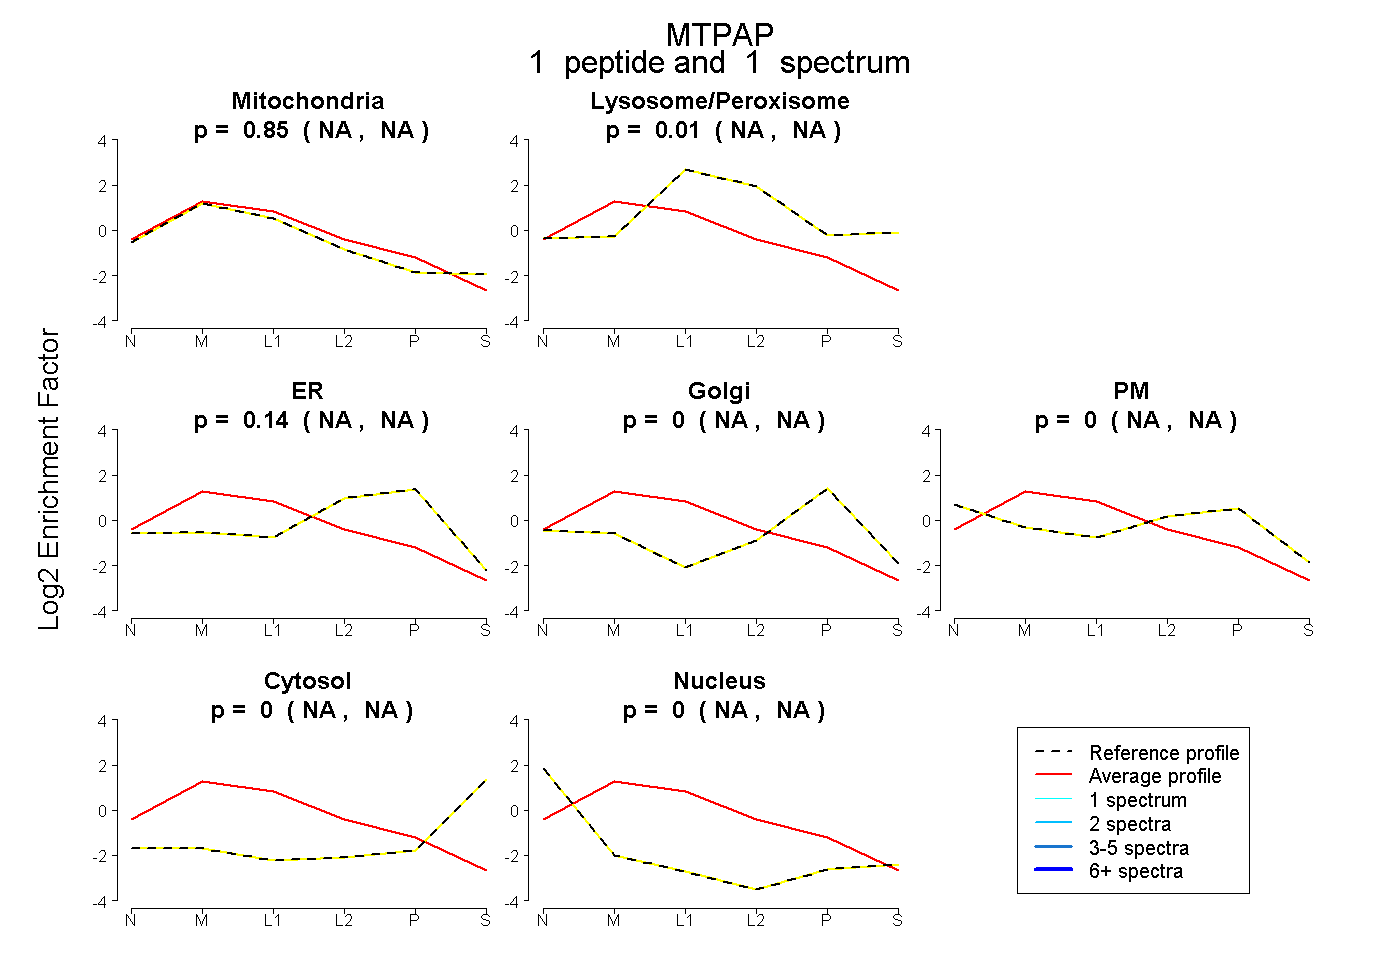
NA | NA
NA | NA
NA | NA
NA | NA
NA | NA
NA | NA
NA | NA
8peptides
spectra
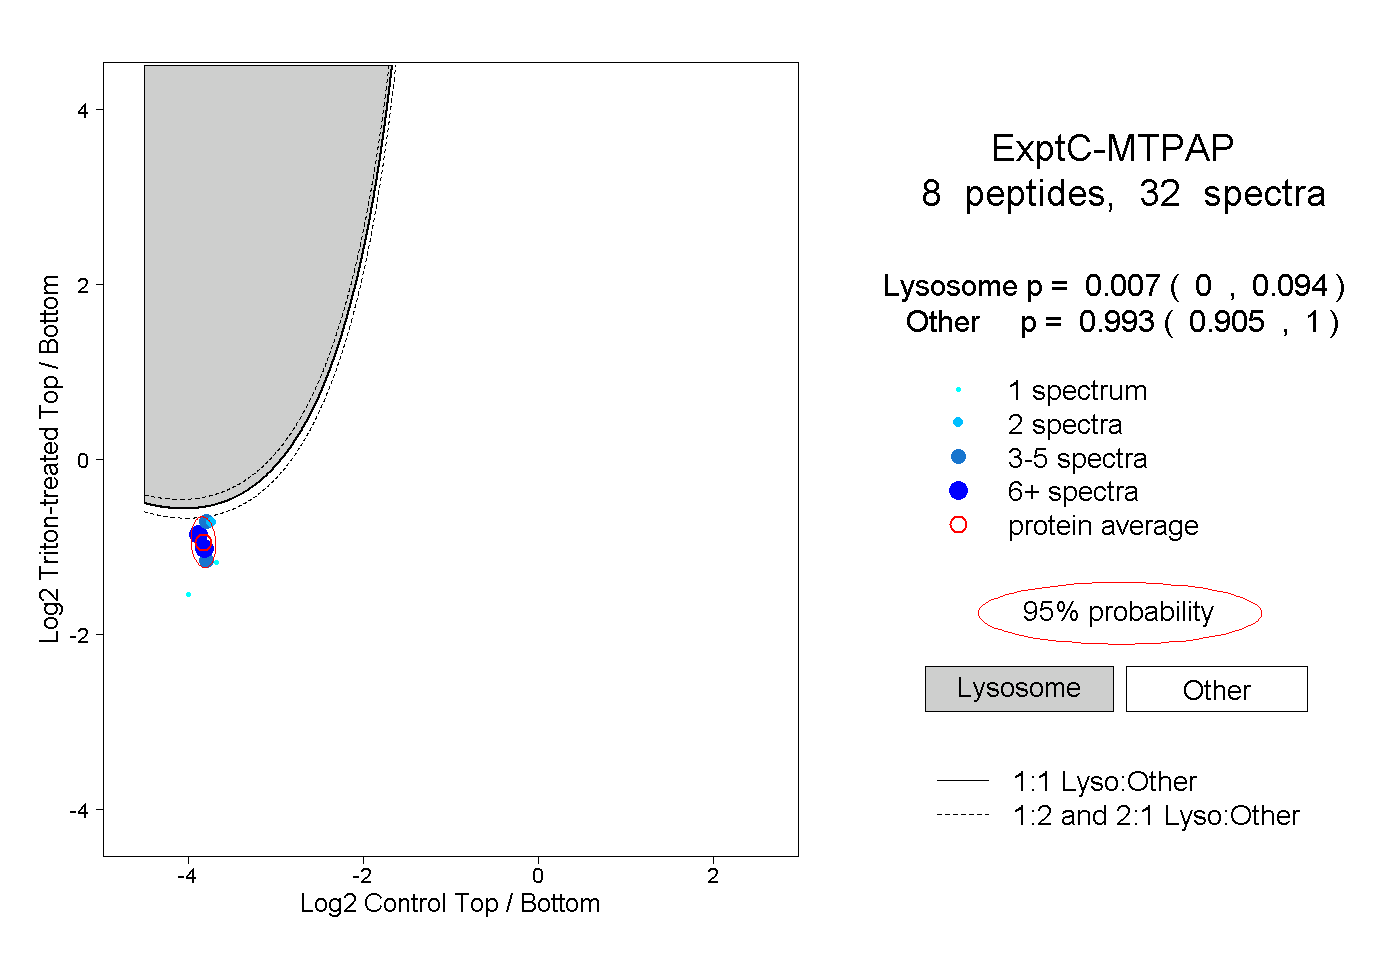
0.000 | 0.094
0.905 | 1.000
3peptides
spectra
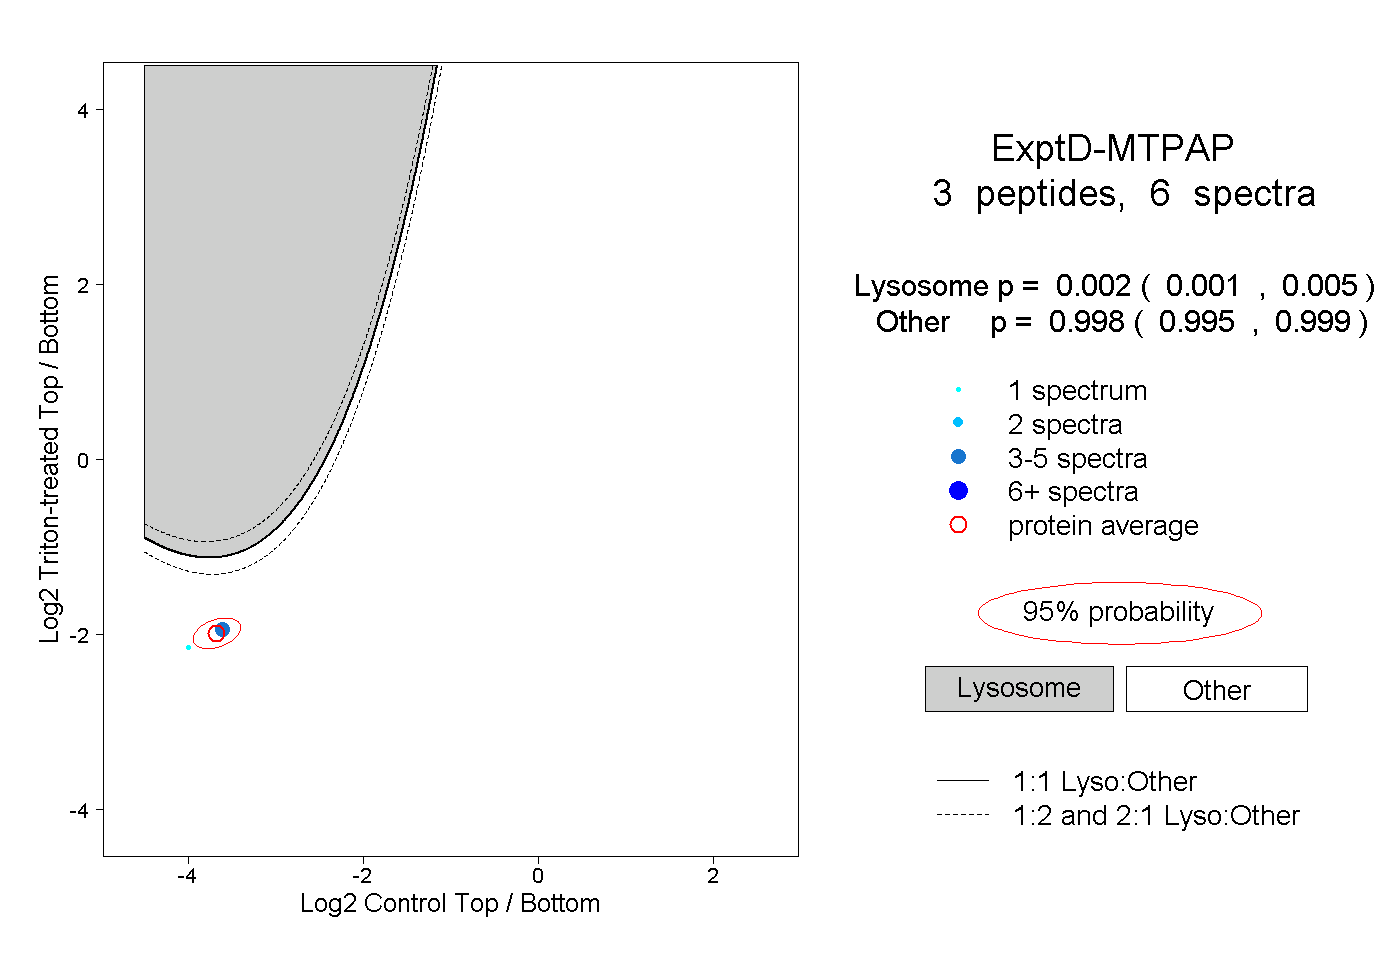
0.001 | 0.005
0.995 | 0.999