 6
6peptides
spectra
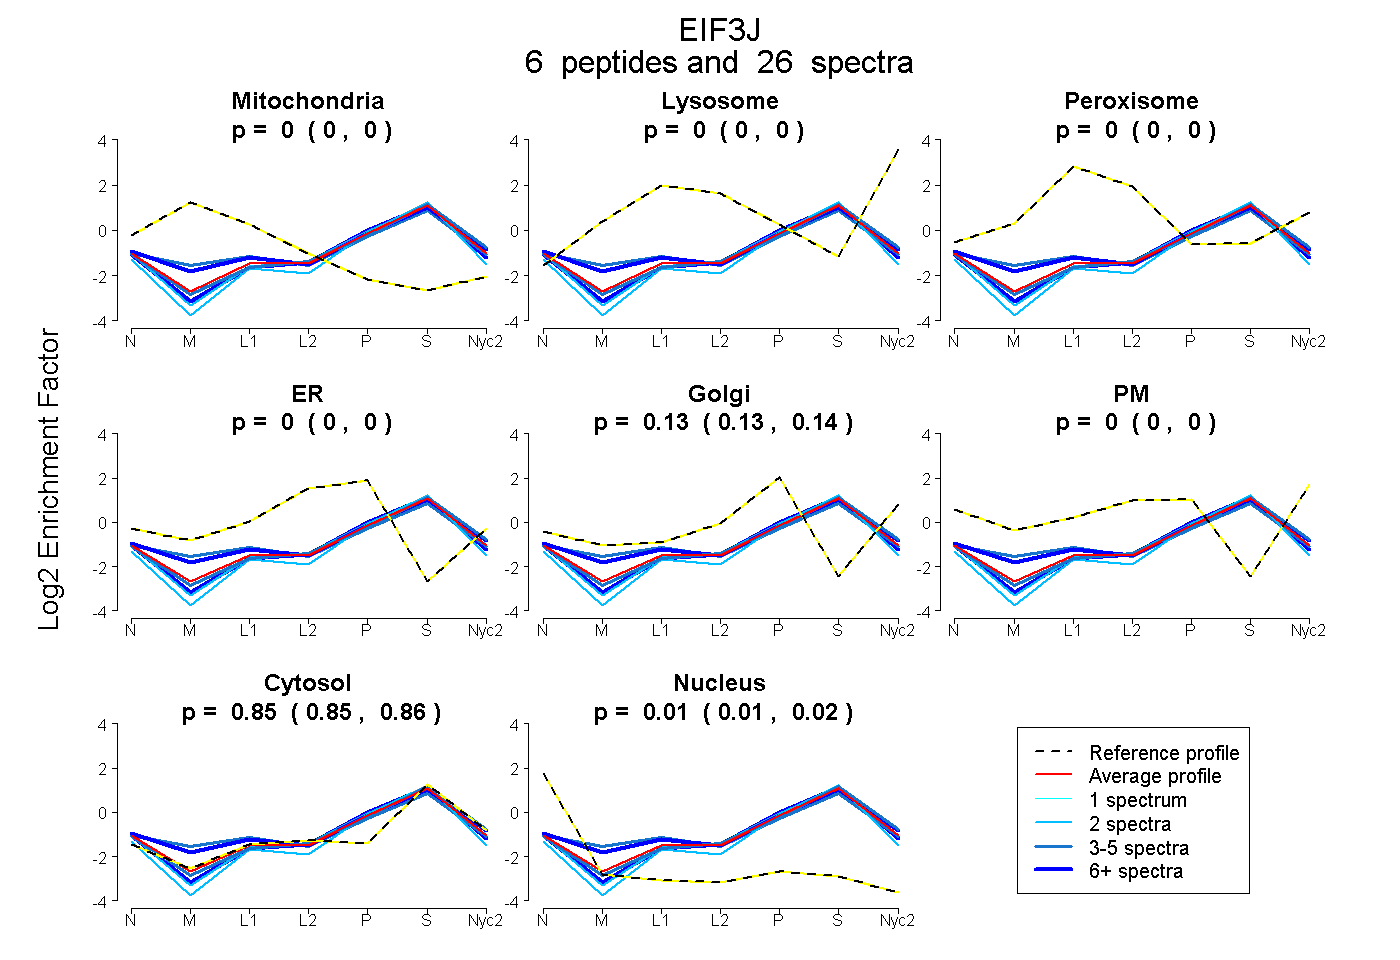
0.000 | 0.000
0.000 | 0.000
0.000 | 0.000
0.000 | 0.000
0.127 | 0.140
0.000 | 0.000
0.845 | 0.856
0.010 | 0.019
| Plot | Mito | Lyso | Perox | ER | Golgi | PM | Cytosol | Nucleus | |||||
| Expt A |
6 peptides |
26 spectra |
|
0.000 0.000 | 0.000 |
0.000 0.000 | 0.000 |
0.000 0.000 | 0.000 |
0.000 0.000 | 0.000 |
0.134 0.127 | 0.140 |
0.000 0.000 | 0.000 |
0.851 0.845 | 0.856 |
0.015 0.010 | 0.019 |
| 2 spectra, LEEPEESK | 0.000 | 0.000 | 0.000 | 0.000 | 0.111 | 0.000 | 0.873 | 0.016 | ||
| 3 spectra, GVVPGGGLK | 0.077 | 0.000 | 0.000 | 0.000 | 0.159 | 0.000 | 0.765 | 0.000 | ||
| 6 spectra, LQEESDLELAK | 0.003 | 0.000 | 0.000 | 0.000 | 0.198 | 0.000 | 0.799 | 0.000 | ||
| 2 spectra, SLYYASFLEALVR | 0.000 | 0.000 | 0.000 | 0.000 | 0.014 | 0.000 | 0.924 | 0.062 | ||
| 9 spectra, DDFTEFGK | 0.000 | 0.000 | 0.000 | 0.000 | 0.110 | 0.000 | 0.863 | 0.028 | ||
| 4 spectra, VAGGGTAGGDR | 0.000 | 0.000 | 0.000 | 0.000 | 0.126 | 0.000 | 0.874 | 0.000 |
| Plot | Mito | Lyso or Perox | ER | Golgi | PM | Cytosol | Nucleus | ||||||
| Expt B |
3 peptides |
5 spectra |
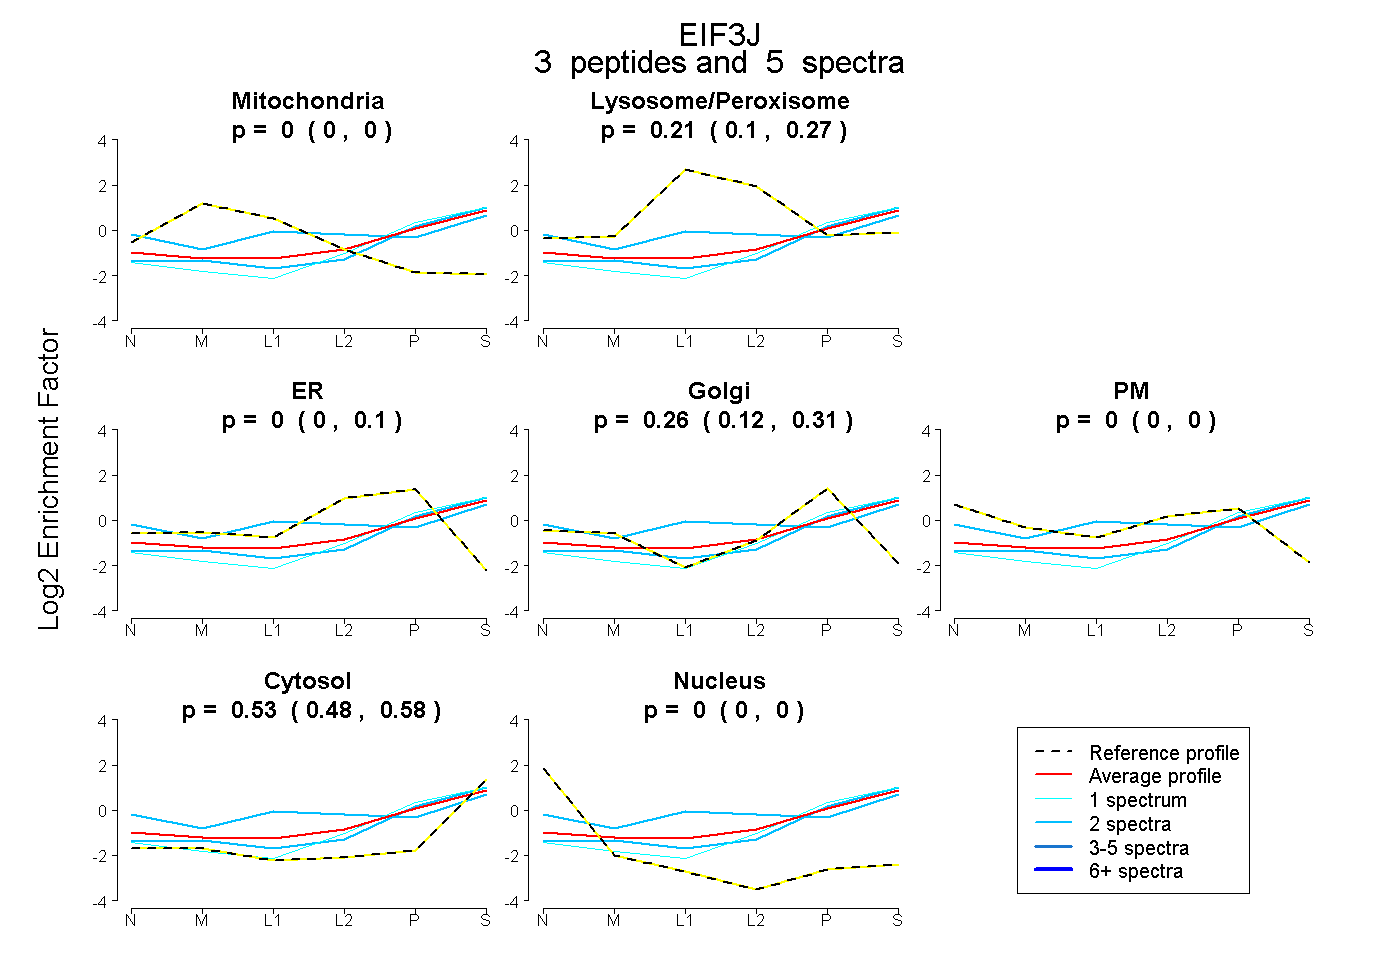 |
0.000 0.000 | 0.000 |
0.205 0.099 | 0.272 |
0.000 0.000 | 0.102 |
0.264 0.122 | 0.311 |
0.000 0.000 | 0.000 |
0.531 0.482 | 0.579 |
0.000 0.000 | 0.000 |
|||
| Plot | Lyso | Other | |||||||||||
| Expt C |
6 peptides |
13 spectra |
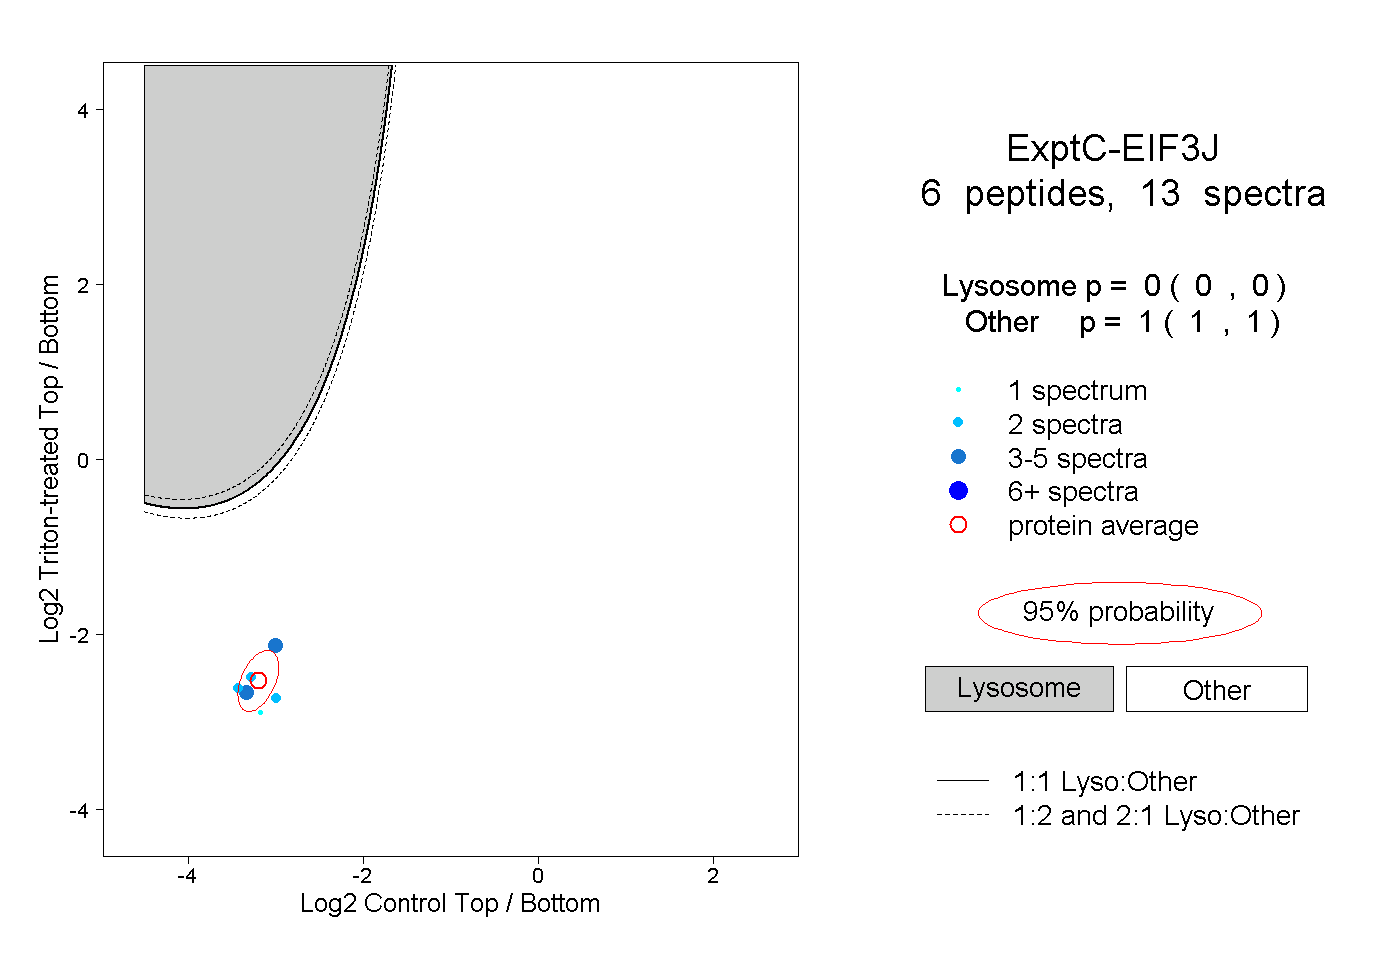 |
0.000 0.000 | 0.000 |
1.000 1.000 | 1.000 |
||||||||
| Plot | Lyso | Other | |||||||||||
| Expt D |
3 peptides |
5 spectra |
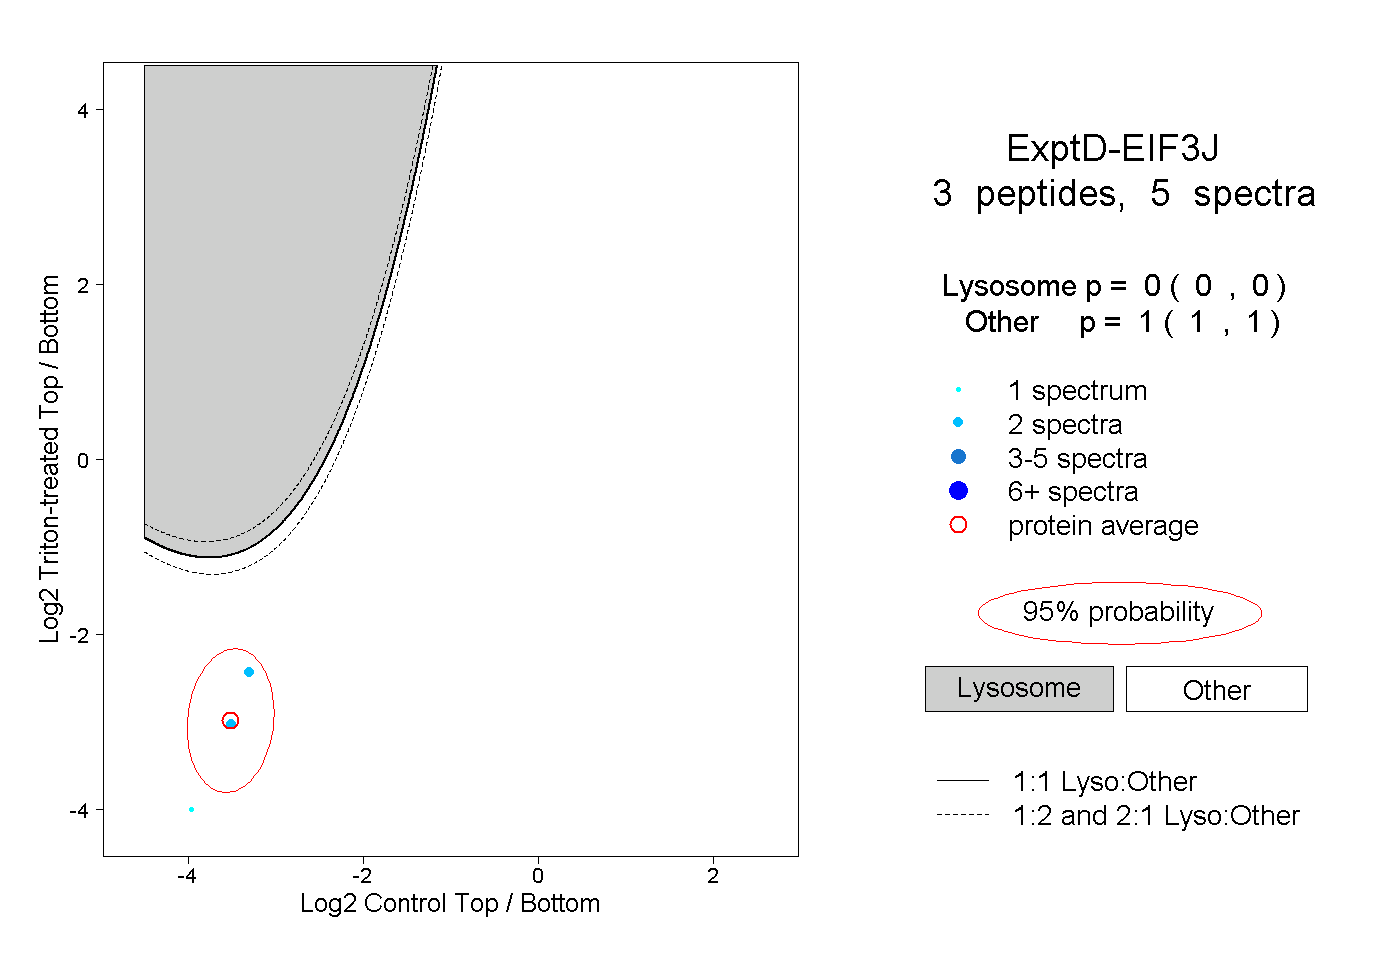 |
0.000 0.000 | 0.000 |
1.000 1.000 | 1.000 |