 6
6peptides
spectra
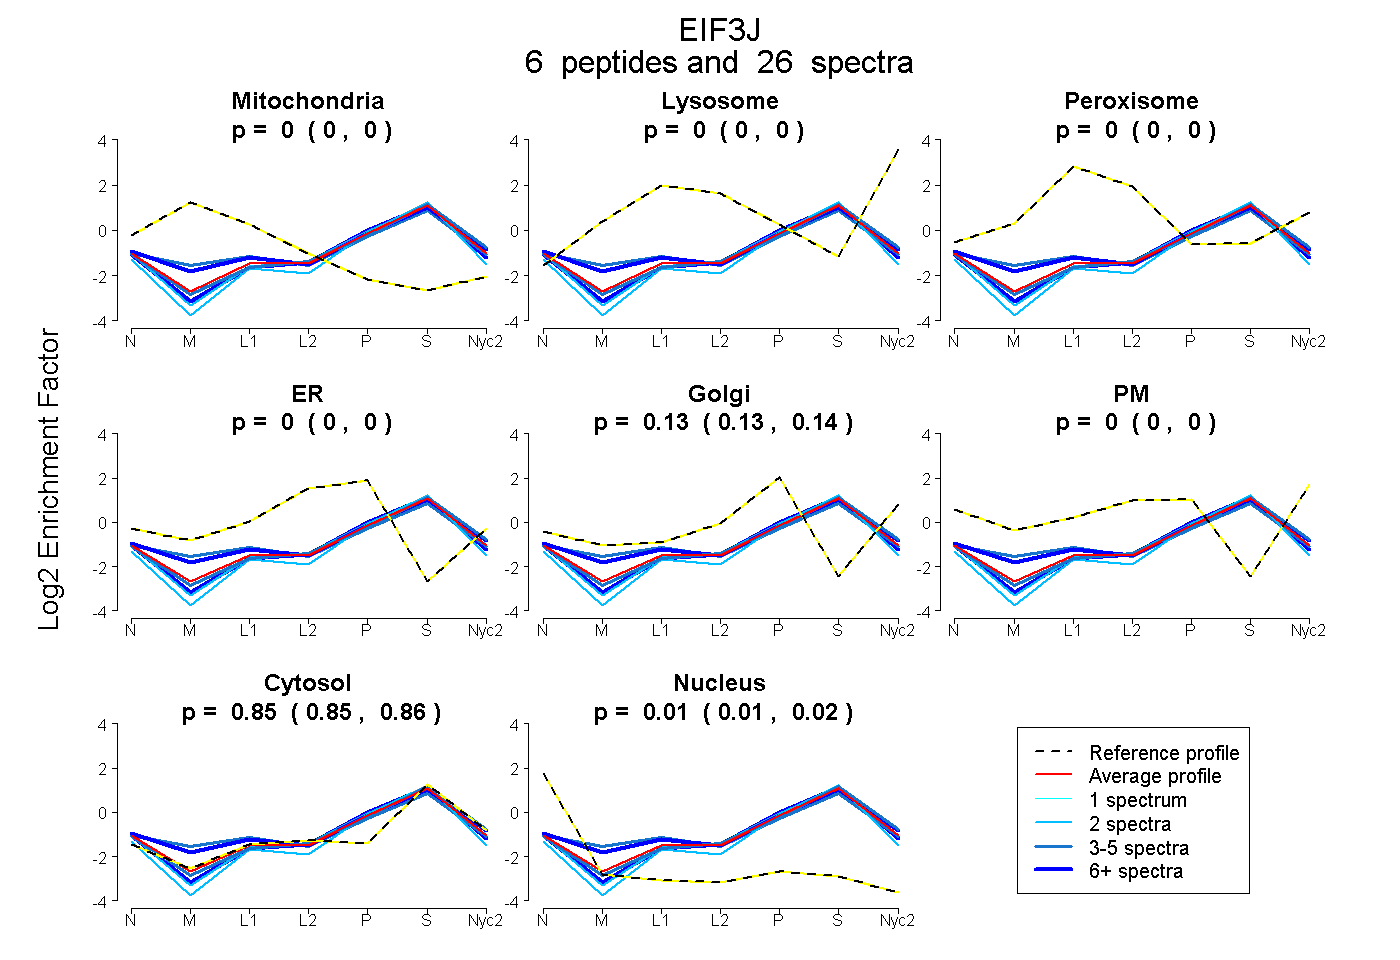
0.000 | 0.000
0.000 | 0.000
0.000 | 0.000
0.000 | 0.000
0.127 | 0.140
0.000 | 0.000
0.845 | 0.856
0.010 | 0.019
3peptides
spectra
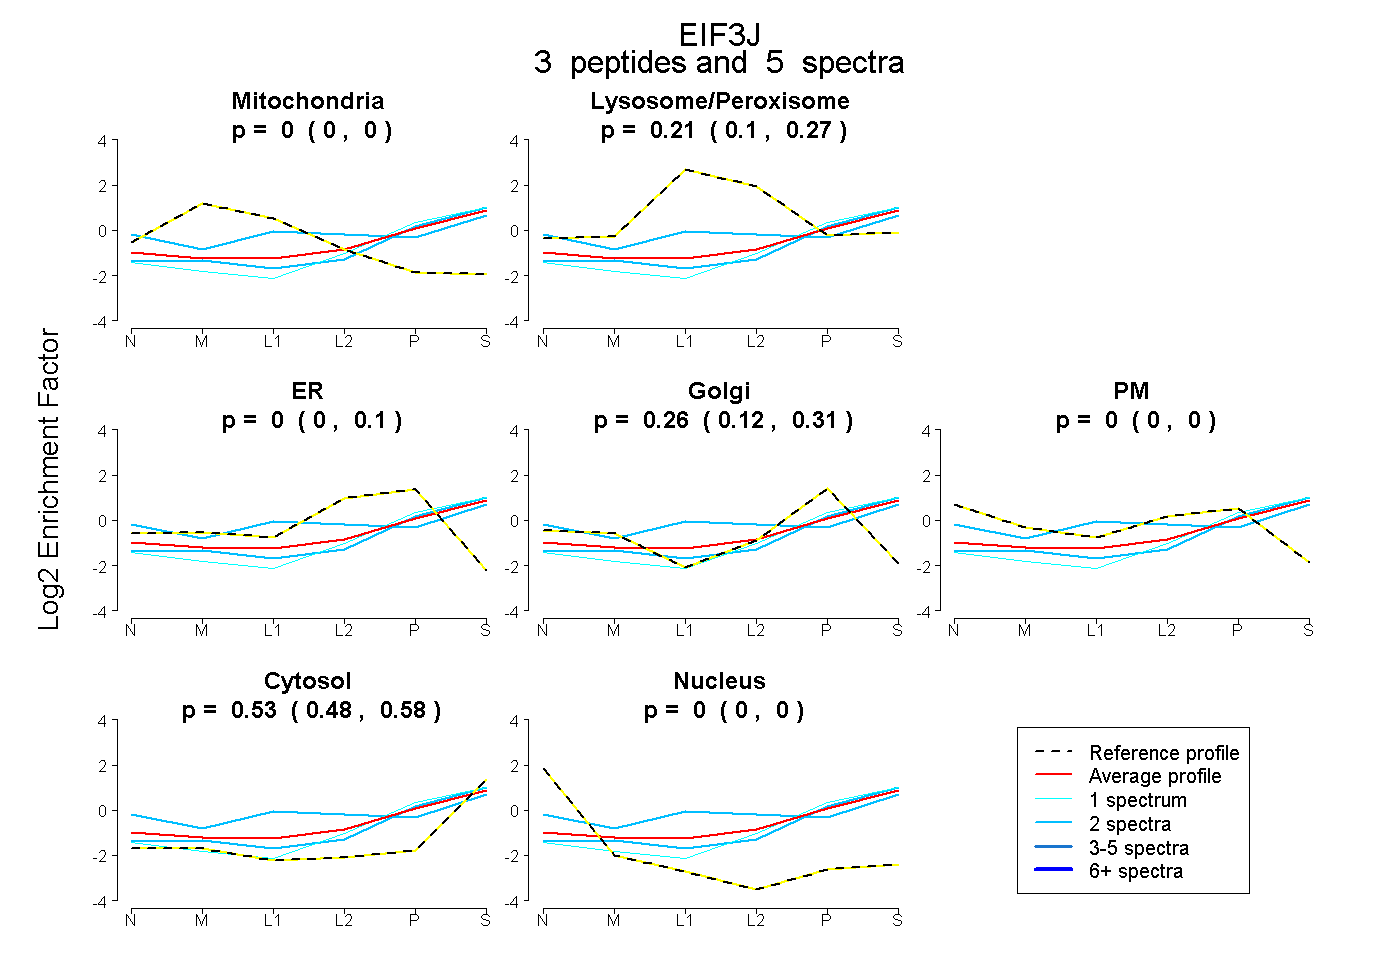
0.000 | 0.000
0.099 | 0.272
0.000 | 0.102
0.122 | 0.311
0.000 | 0.000
0.482 | 0.579
0.000 | 0.000
6peptides
spectra
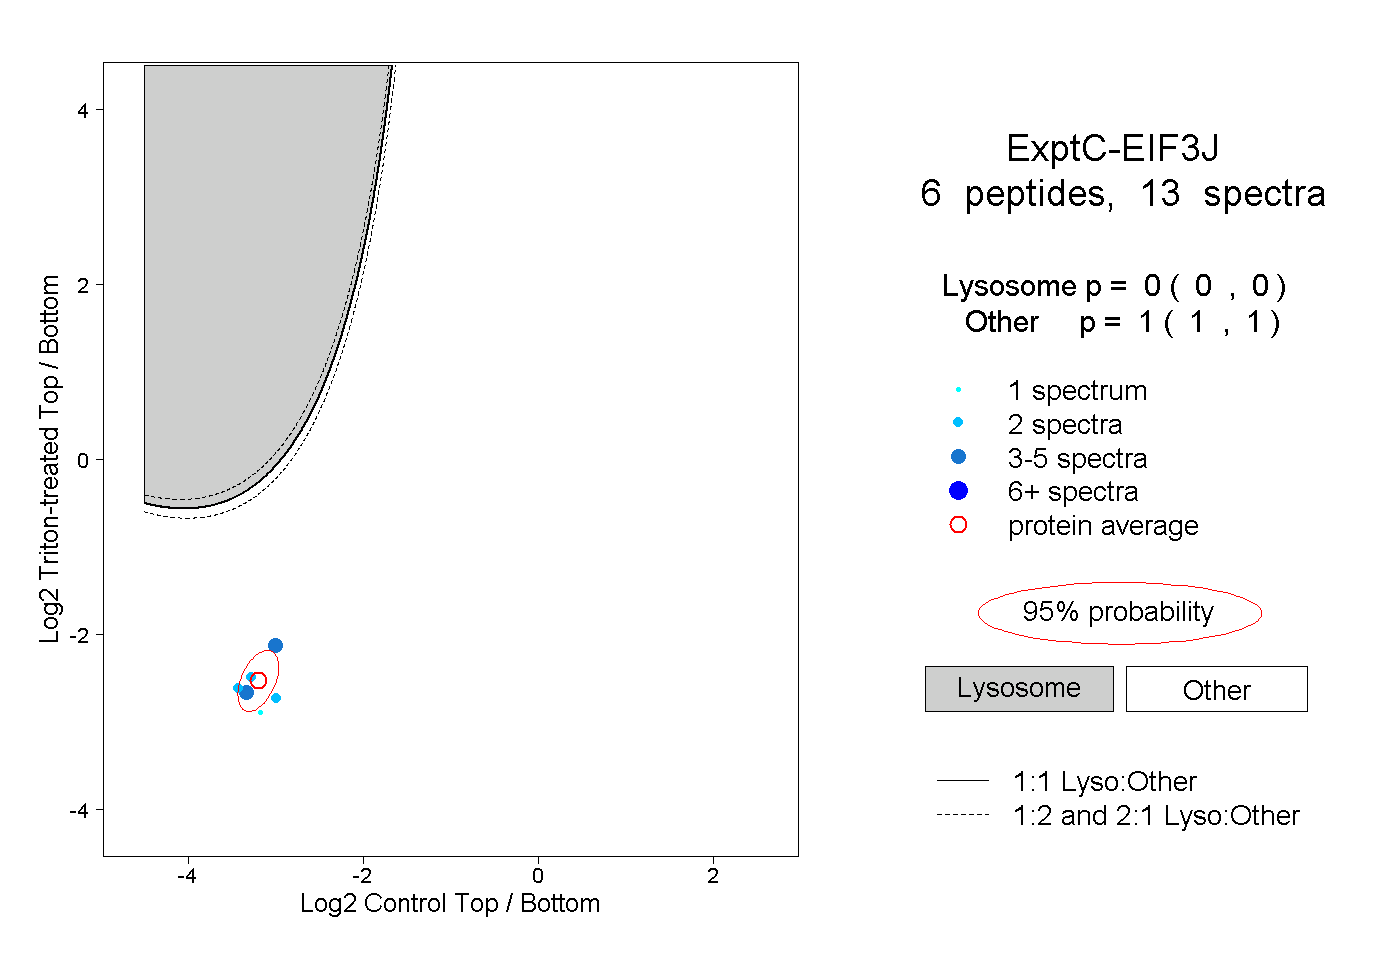
0.000 | 0.000
1.000 | 1.000
3peptides
spectra
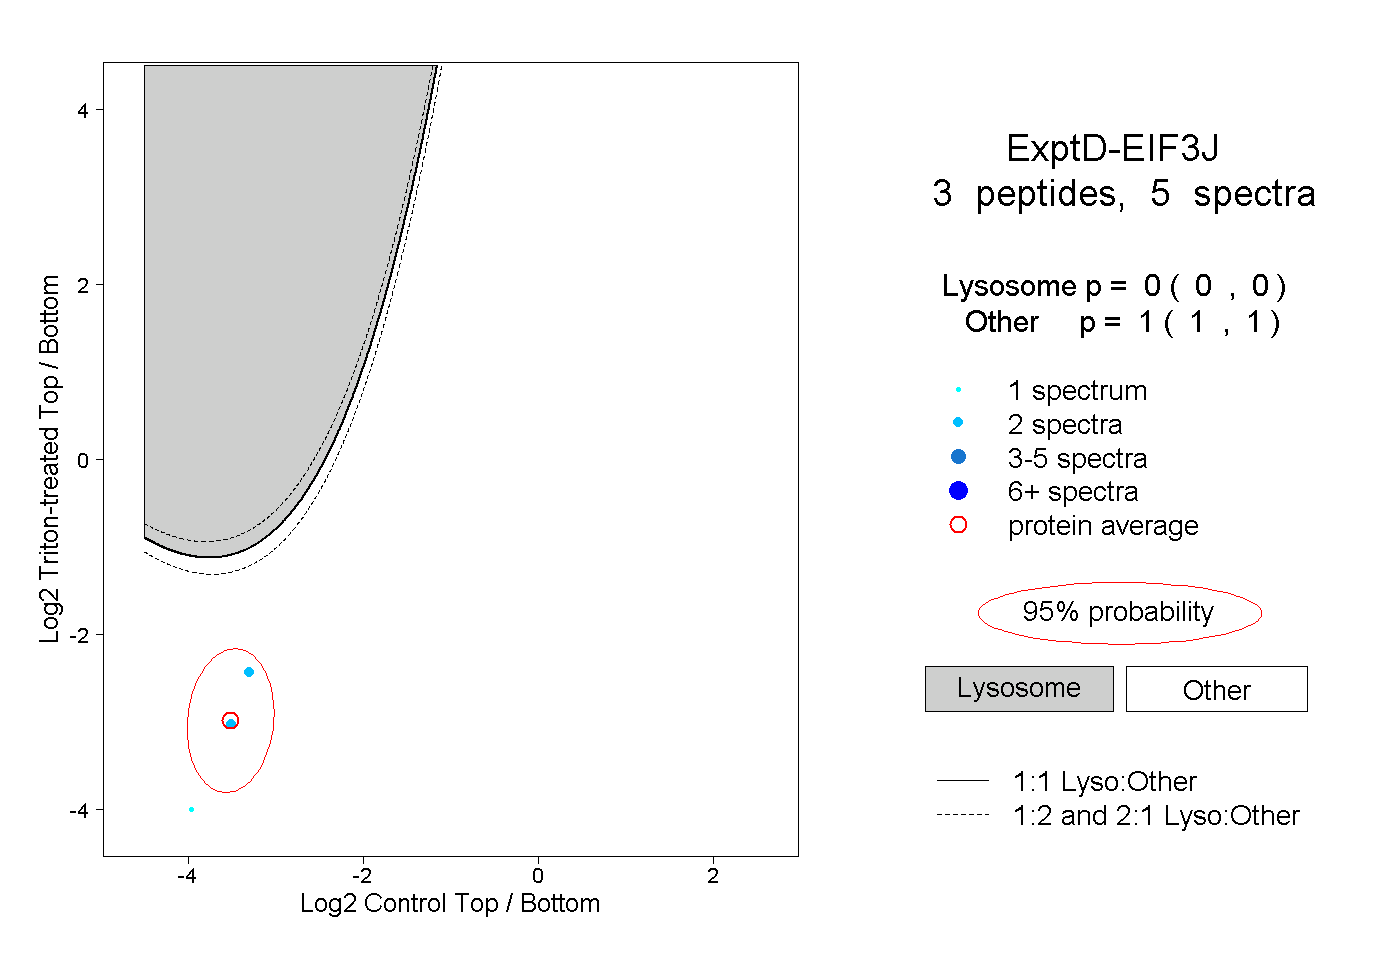
0.000 | 0.000
1.000 | 1.000