 10
10peptides
spectra
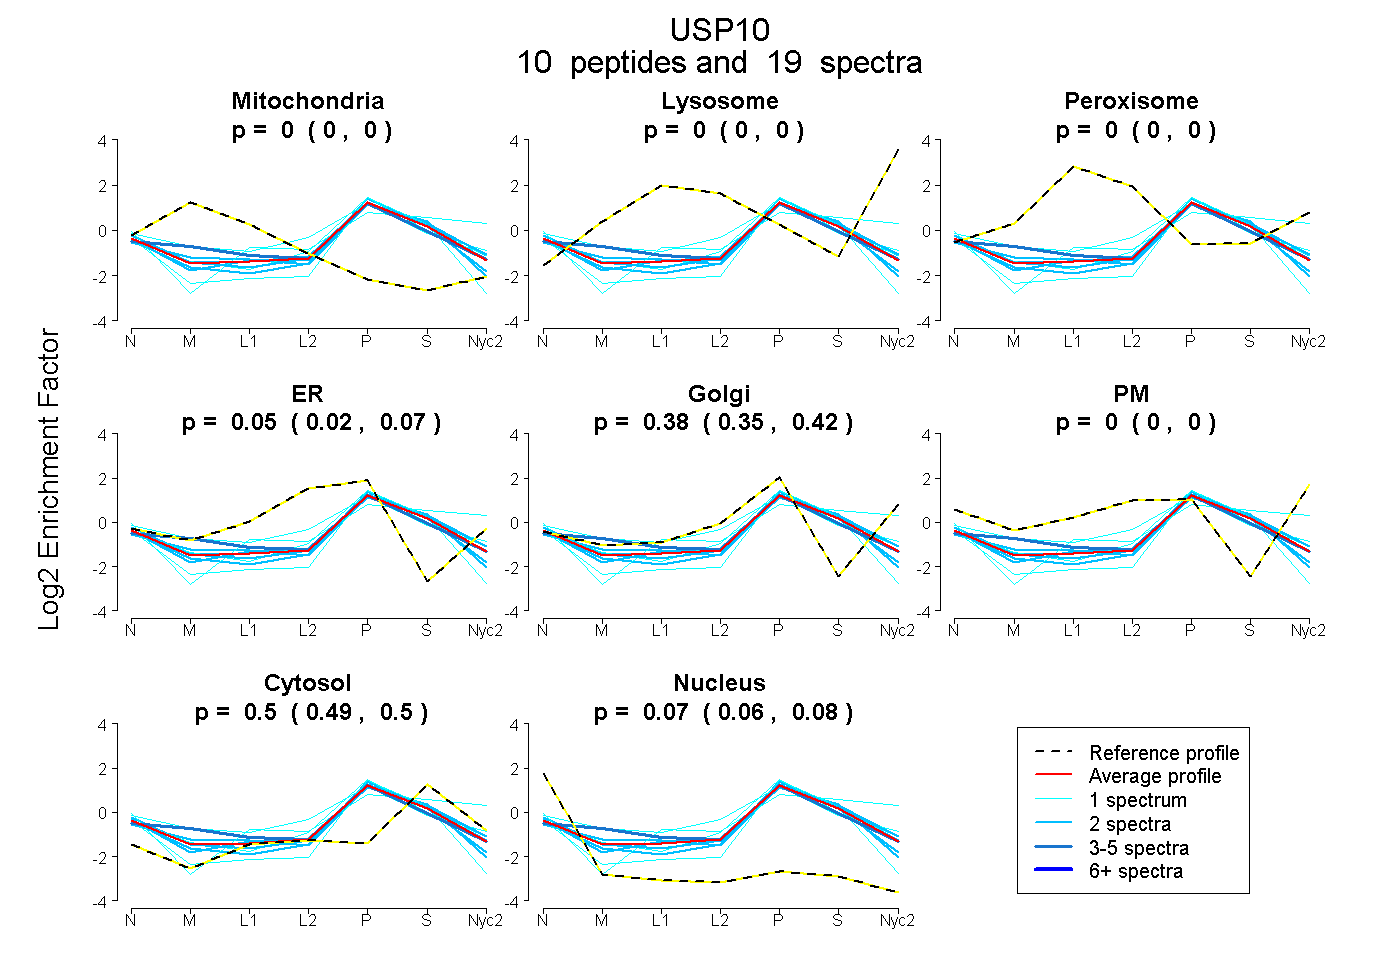
0.000 | 0.000
0.000 | 0.000
0.000 | 0.000
0.019 | 0.074
0.349 | 0.415
0.000 | 0.000
0.491 | 0.503
0.060 | 0.075
4peptides
spectra
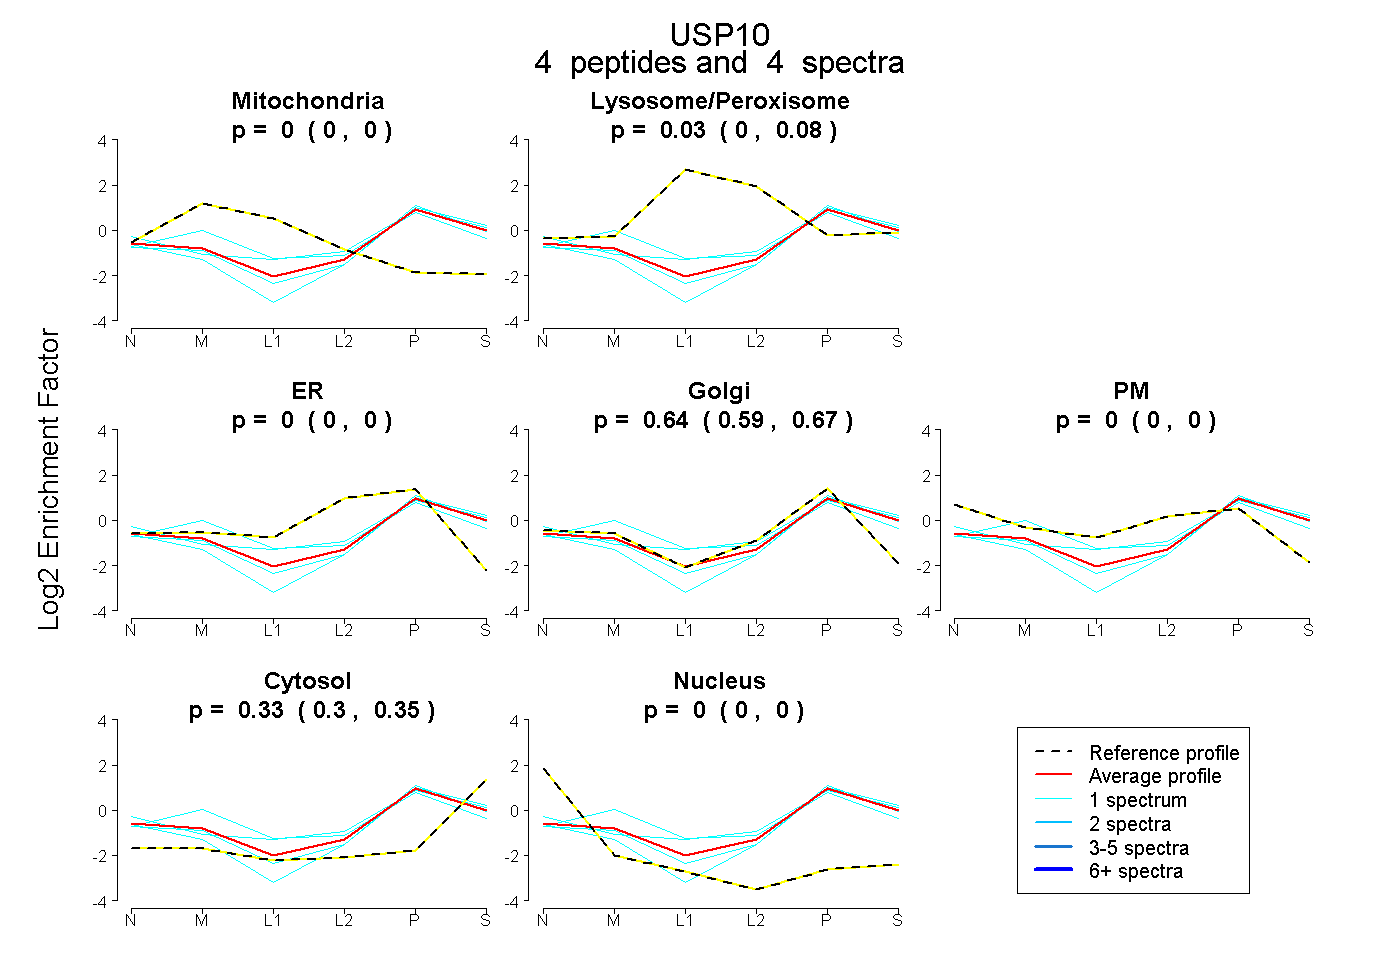
0.000 | 0.000
0.000 | 0.084
0.000 | 0.000
0.585 | 0.667
0.000 | 0.000
0.300 | 0.354
0.000 | 0.000
5peptides
spectra
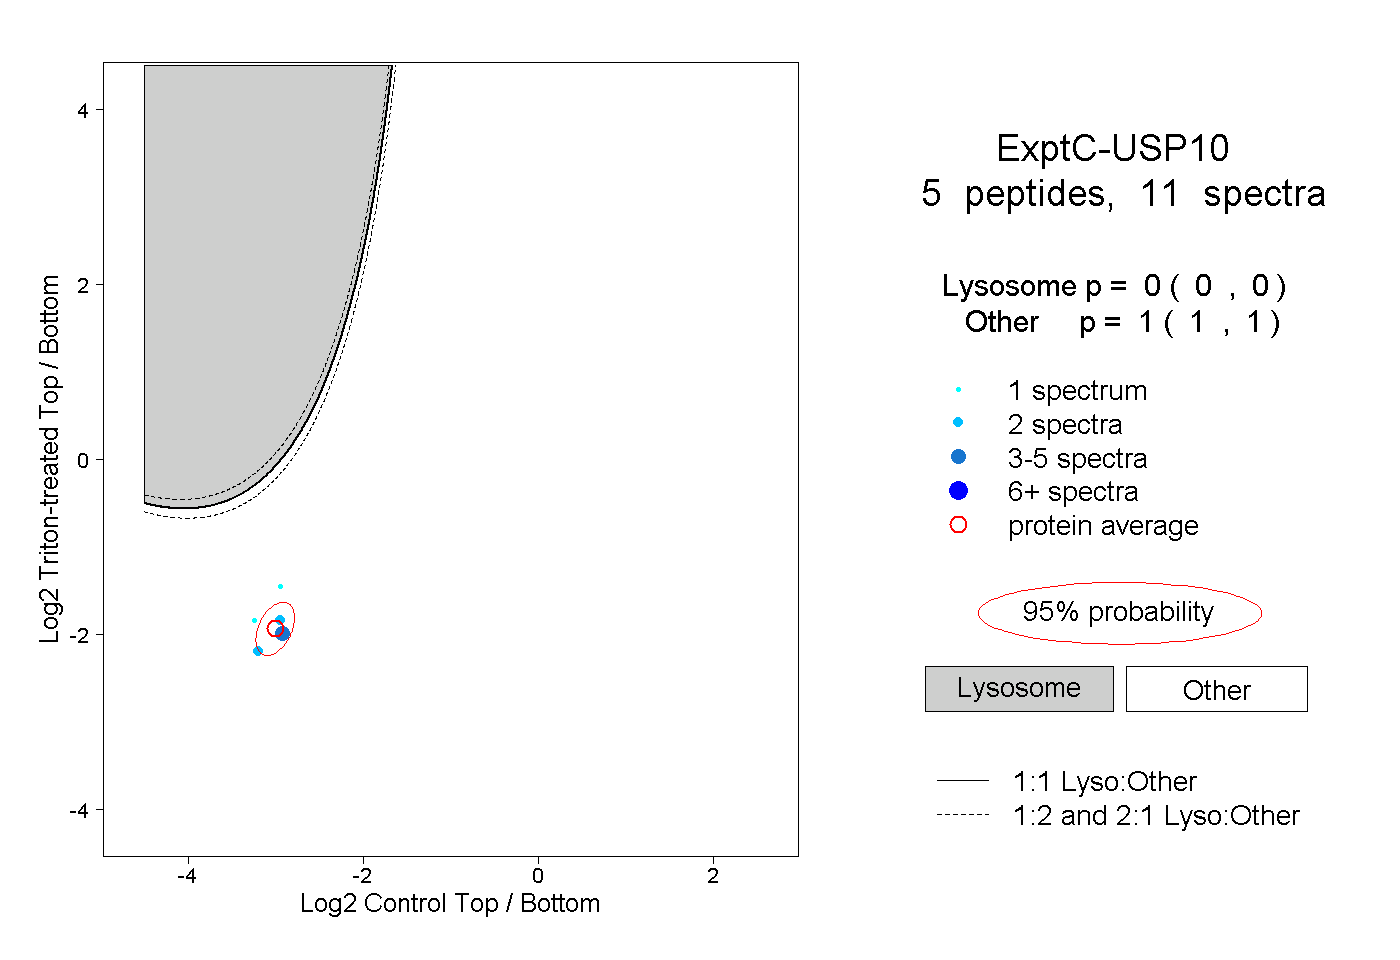
0.000 | 0.000
1.000 | 1.000