 4
4peptides
spectra
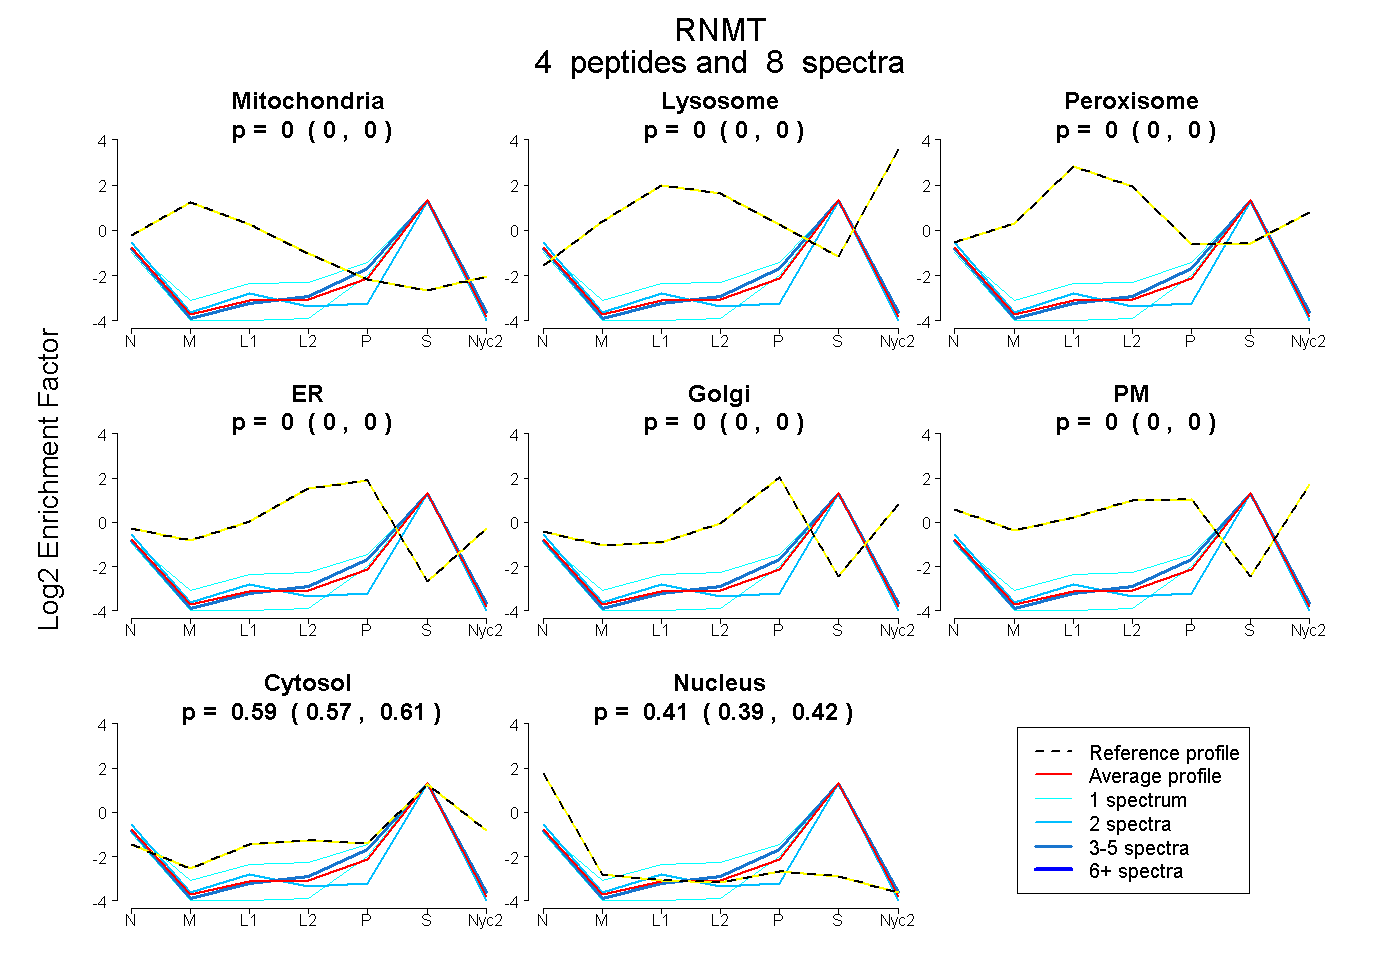
0.000 | 0.000
0.000 | 0.000
0.000 | 0.000
0.000 | 0.000
0.000 | 0.000
0.000 | 0.000
0.574 | 0.606
0.392 | 0.424
| Plot | Mito | Lyso | Perox | ER | Golgi | PM | Cytosol | Nucleus | |||||
| Expt A |
4 peptides |
8 spectra |
|
0.000 0.000 | 0.000 |
0.000 0.000 | 0.000 |
0.000 0.000 | 0.000 |
0.000 0.000 | 0.000 |
0.000 0.000 | 0.000 |
0.000 0.000 | 0.000 |
0.591 0.574 | 0.606 |
0.409 0.392 | 0.424 |
| 1 spectrum, GGGSEDEPSPGGLTER | 0.000 | 0.000 | 0.000 | 0.000 | 0.000 | 0.000 | 0.533 | 0.467 | ||
| 1 spectrum, LVCADIADISMK | 0.000 | 0.000 | 0.000 | 0.000 | 0.000 | 0.000 | 0.666 | 0.334 | ||
| 4 spectra, TFLEFYEEK | 0.000 | 0.000 | 0.000 | 0.000 | 0.000 | 0.000 | 0.619 | 0.381 | ||
| 2 spectra, SILIGEILEK | 0.000 | 0.000 | 0.000 | 0.000 | 0.000 | 0.000 | 0.529 | 0.471 |
| Plot | Mito | Lyso or Perox | ER | Golgi | PM | Cytosol | Nucleus | ||||||
| Expt B |
2 peptides |
3 spectra |
 |
0.000 0.000 | 0.000 |
0.000 0.000 | 0.000 |
0.000 0.000 | 0.000 |
0.000 0.000 | 0.000 |
0.000 0.000 | 0.000 |
0.794 0.778 | 0.808 |
0.206 0.188 | 0.219 |