 99
99peptides
spectra
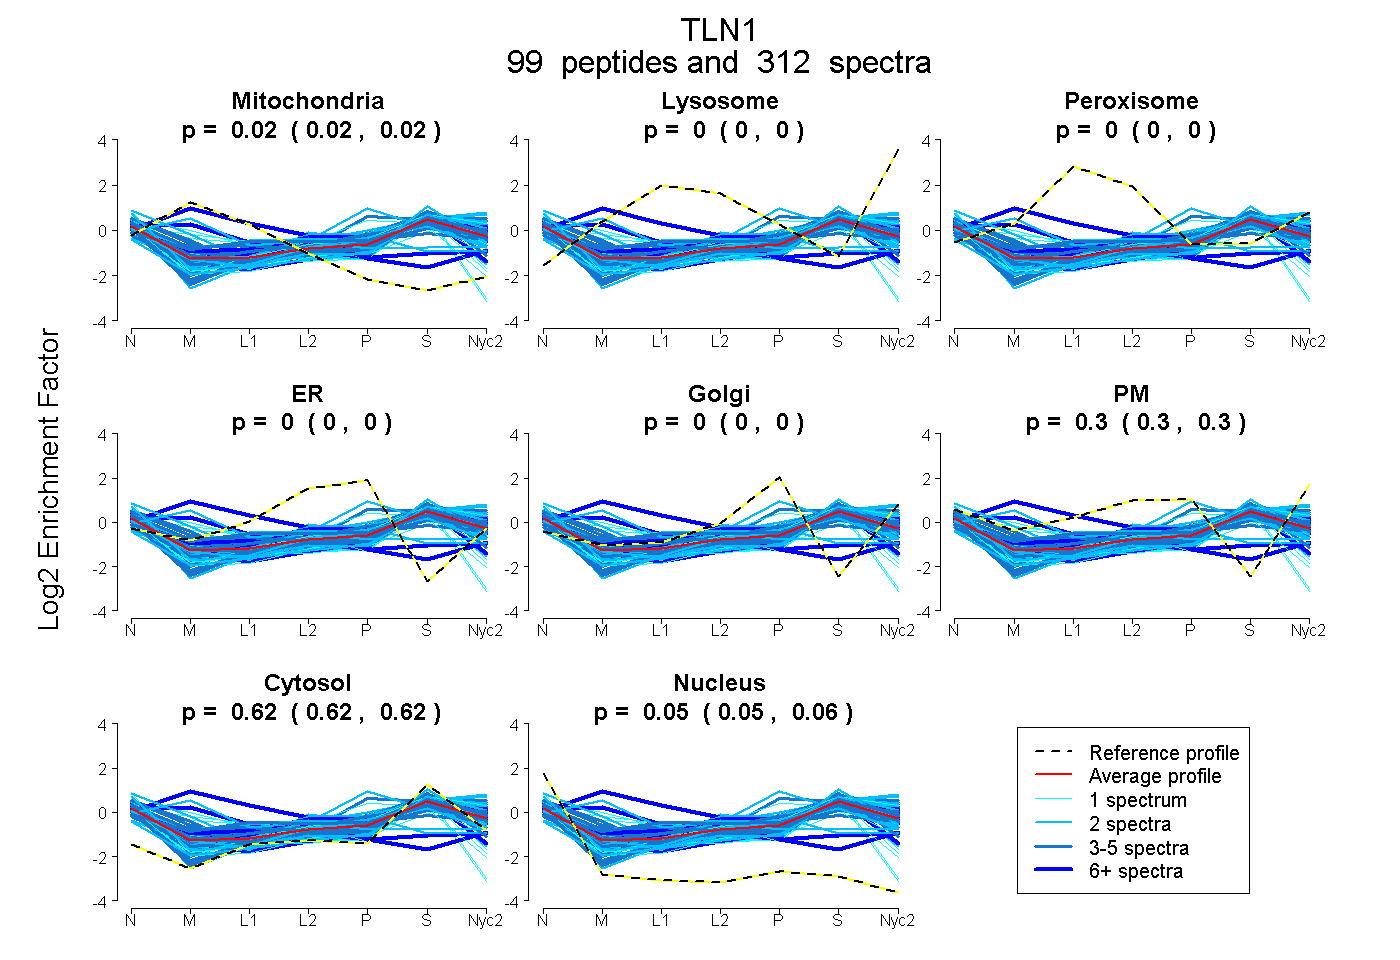
0.022 | 0.024
0.000 | 0.000
0.000 | 0.000
0.000 | 0.000
0.000 | 0.000
0.302 | 0.304
0.618 | 0.620
0.054 | 0.055
42peptides
spectra

0.000 | 0.000
0.069 | 0.079
0.000 | 0.000
0.000 | 0.000
0.450 | 0.461
0.409 | 0.414
0.055 | 0.061
98peptides
spectra
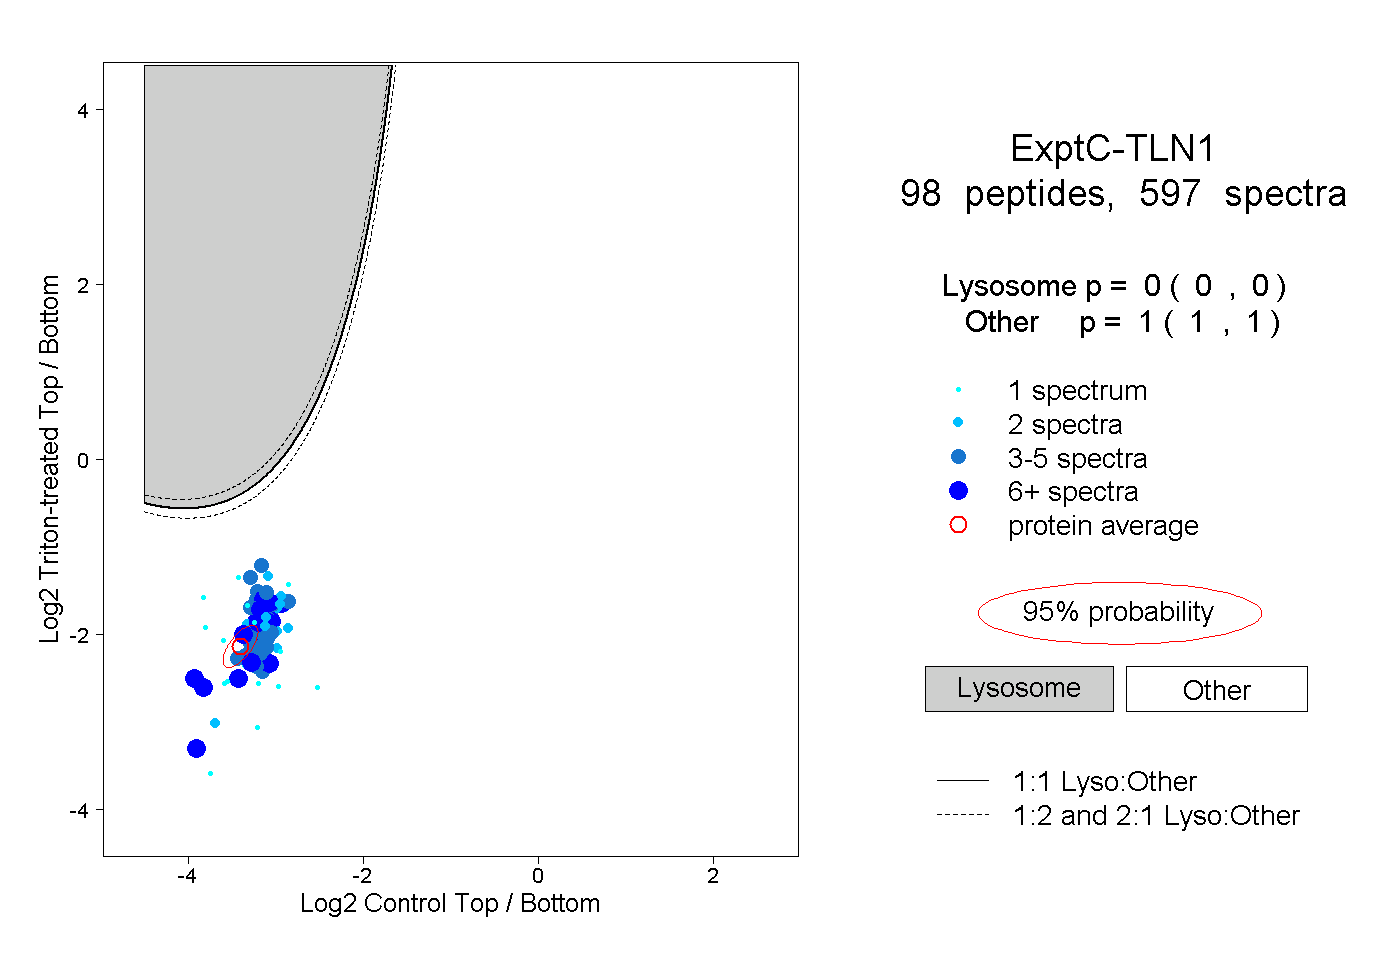
0.000 | 0.000
1.000 | 1.000
32peptides
spectra
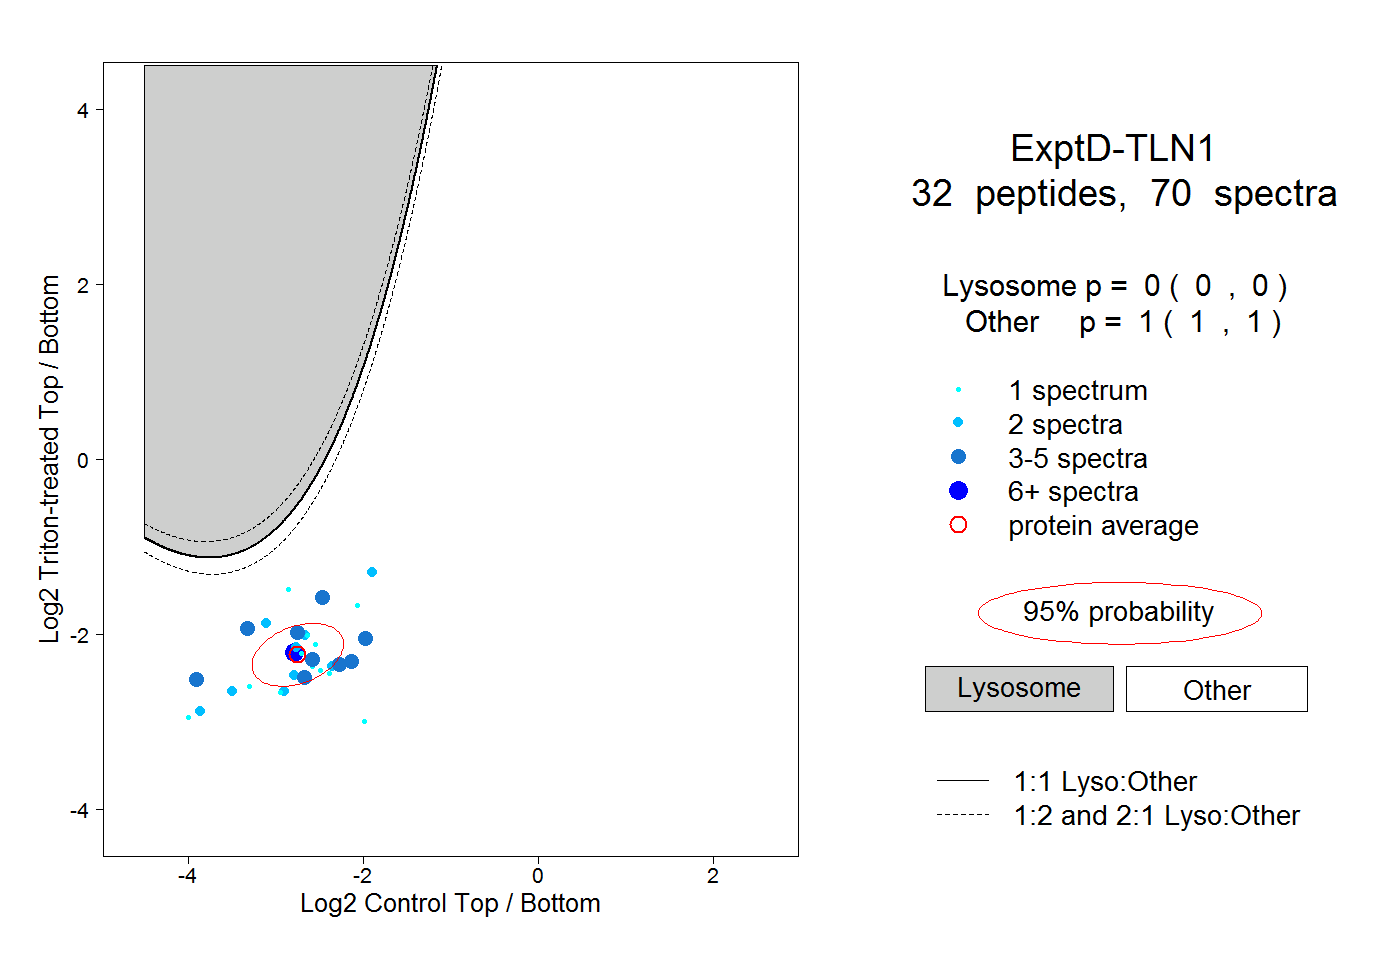
0.000 | 0.000
1.000 | 1.000