 7
7peptides
spectra
0.346 | 0.362
0.000 | 0.000
0.000 | 0.000
0.000 | 0.000
0.000 | 0.000
0.000 | 0.000
0.637 | 0.652
0.000 | 0.000
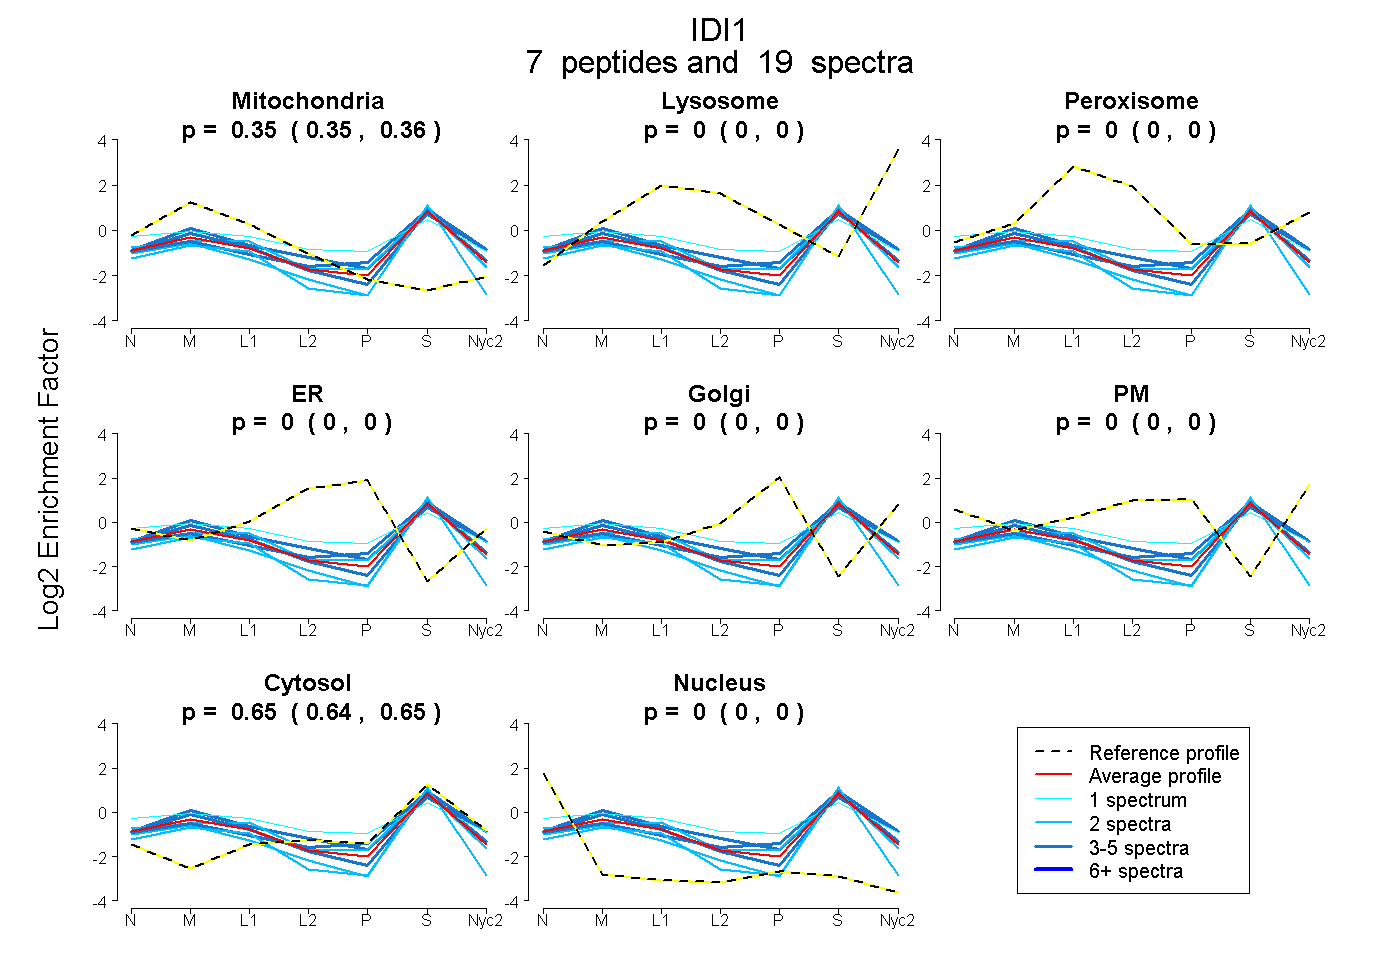
| Plot | Mito | Lyso | Perox | ER | Golgi | PM | Cytosol | Nucleus | |||||
| Expt A |
7 peptides |
19 spectra |
|
0.355 0.346 | 0.362 |
0.000 0.000 | 0.000 |
0.000 0.000 | 0.000 |
0.000 0.000 | 0.000 |
0.000 0.000 | 0.000 |
0.000 0.000 | 0.000 |
0.645 0.637 | 0.652 |
0.000 0.000 | 0.000 |
| 4 spectra, LTPWFK | 0.270 | 0.027 | 0.000 | 0.000 | 0.000 | 0.000 | 0.703 | 0.000 | ||
| 4 spectra, AFSVFLFNTENK | 0.344 | 0.030 | 0.059 | 0.000 | 0.000 | 0.000 | 0.567 | 0.000 | ||
| 2 spectra, IIADAFLFK | 0.285 | 0.000 | 0.000 | 0.000 | 0.000 | 0.000 | 0.680 | 0.034 | ||
| 1 spectrum, NCHLNENIDK | 0.299 | 0.000 | 0.179 | 0.000 | 0.000 | 0.026 | 0.497 | 0.000 | ||
| 4 spectra, ILLQQR | 0.383 | 0.000 | 0.000 | 0.000 | 0.000 | 0.000 | 0.617 | 0.000 | ||
| 2 spectra, SYCYVSK | 0.276 | 0.000 | 0.000 | 0.000 | 0.000 | 0.000 | 0.622 | 0.101 | ||
| 2 spectra, AQSDGIWGEHEIDYILFLR | 0.352 | 0.000 | 0.000 | 0.000 | 0.000 | 0.000 | 0.648 | 0.000 |
| Plot | Mito | Lyso or Perox | ER | Golgi | PM | Cytosol | Nucleus | ||||||
| Expt B |
5 peptides |
13 spectra |
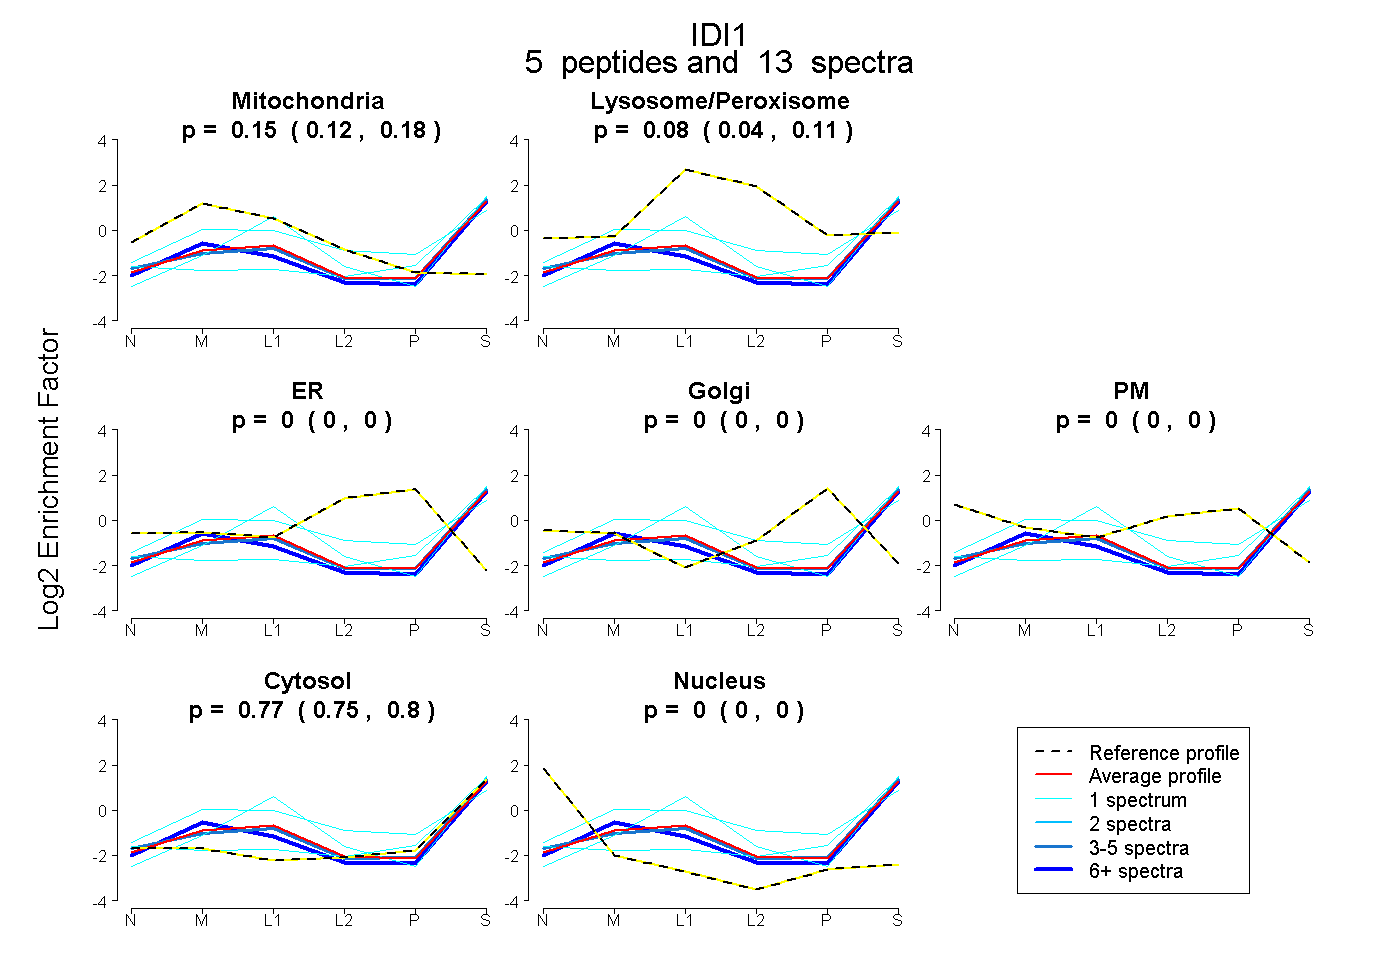 |
0.149 0.119 | 0.178 |
0.077 0.041 | 0.106 |
0.000 0.000 | 0.000 |
0.000 0.000 | 0.000 |
0.000 0.000 | 0.000 |
0.774 0.746 | 0.797 |
0.000 0.000 | 0.000 |
|||
| Plot | Lyso | Other | |||||||||||
| Expt C |
5 peptides |
33 spectra |
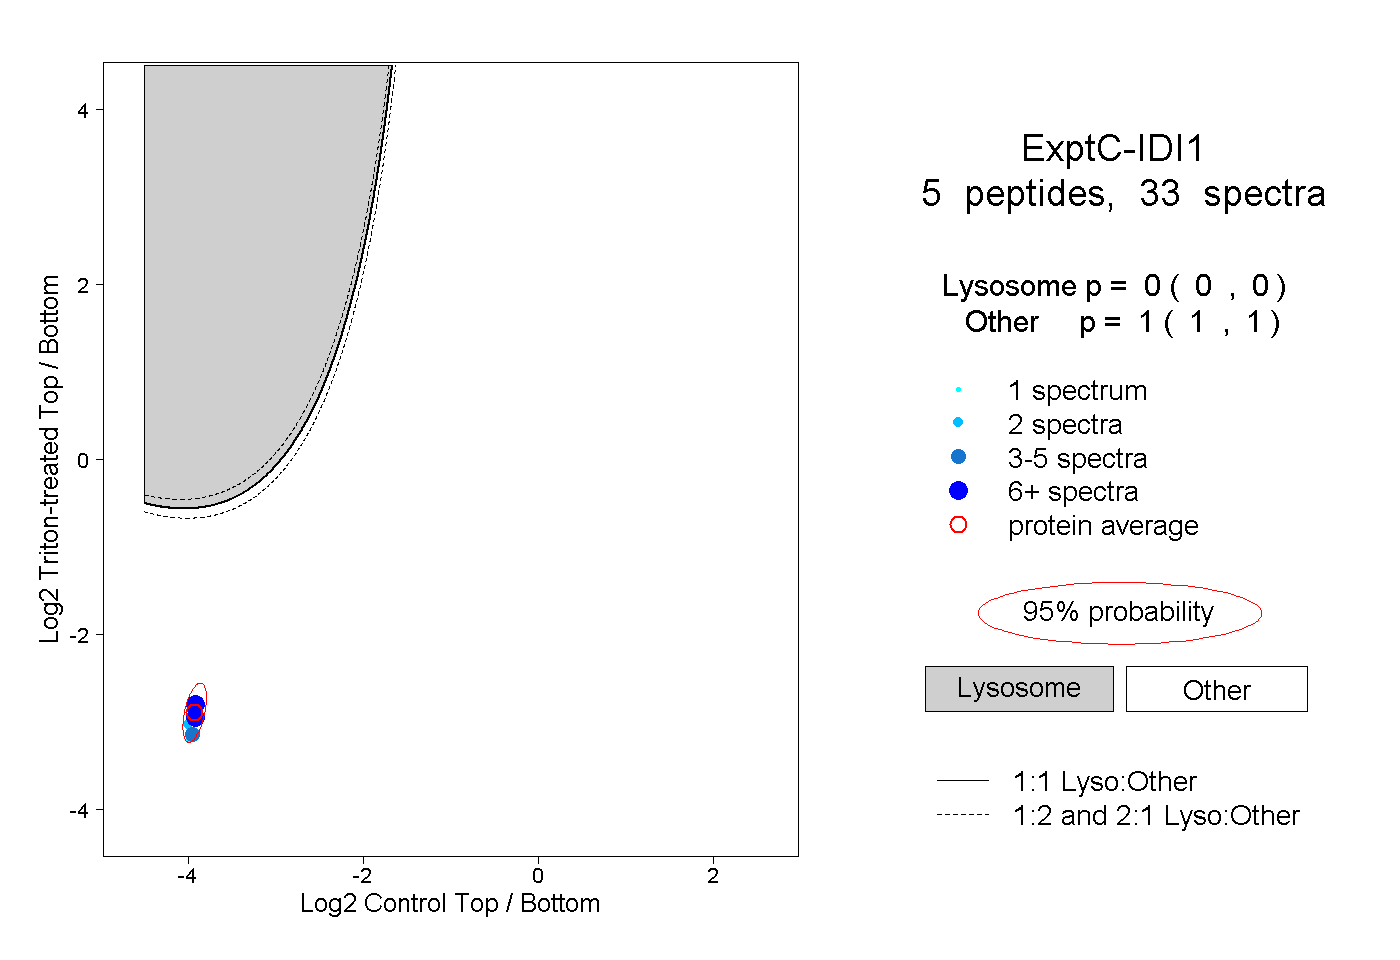 |
0.000 0.000 | 0.000 |
1.000 1.000 | 1.000 |
||||||||
| Plot | Lyso | Other | |||||||||||
| Expt D |
2 peptides |
3 spectra |
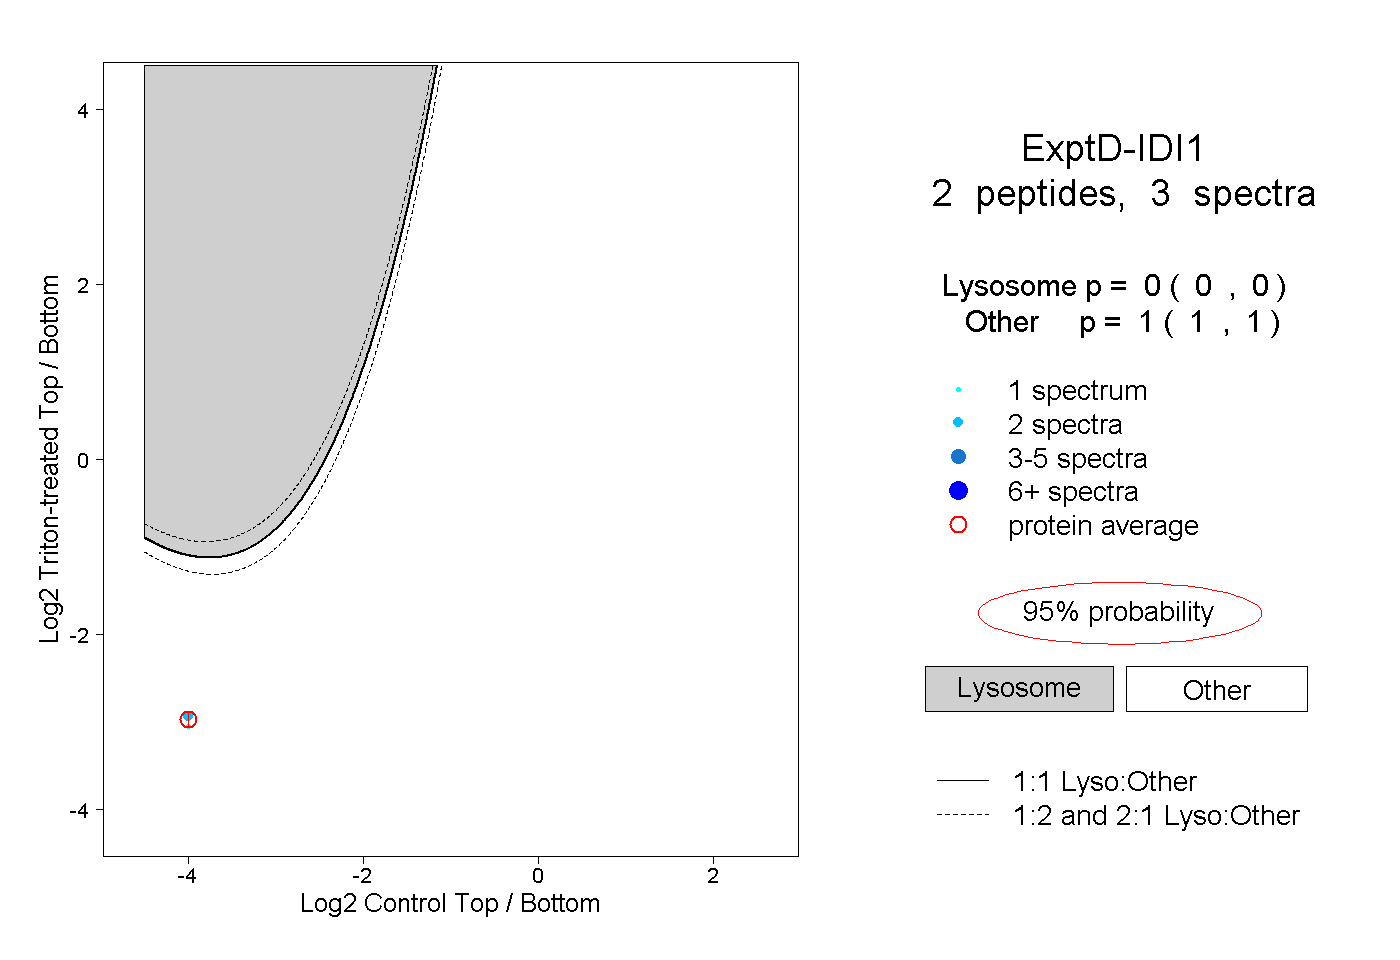 |
0.000 0.000 | 0.000 |
1.000 1.000 | 1.000 |