 3
3peptides
spectra
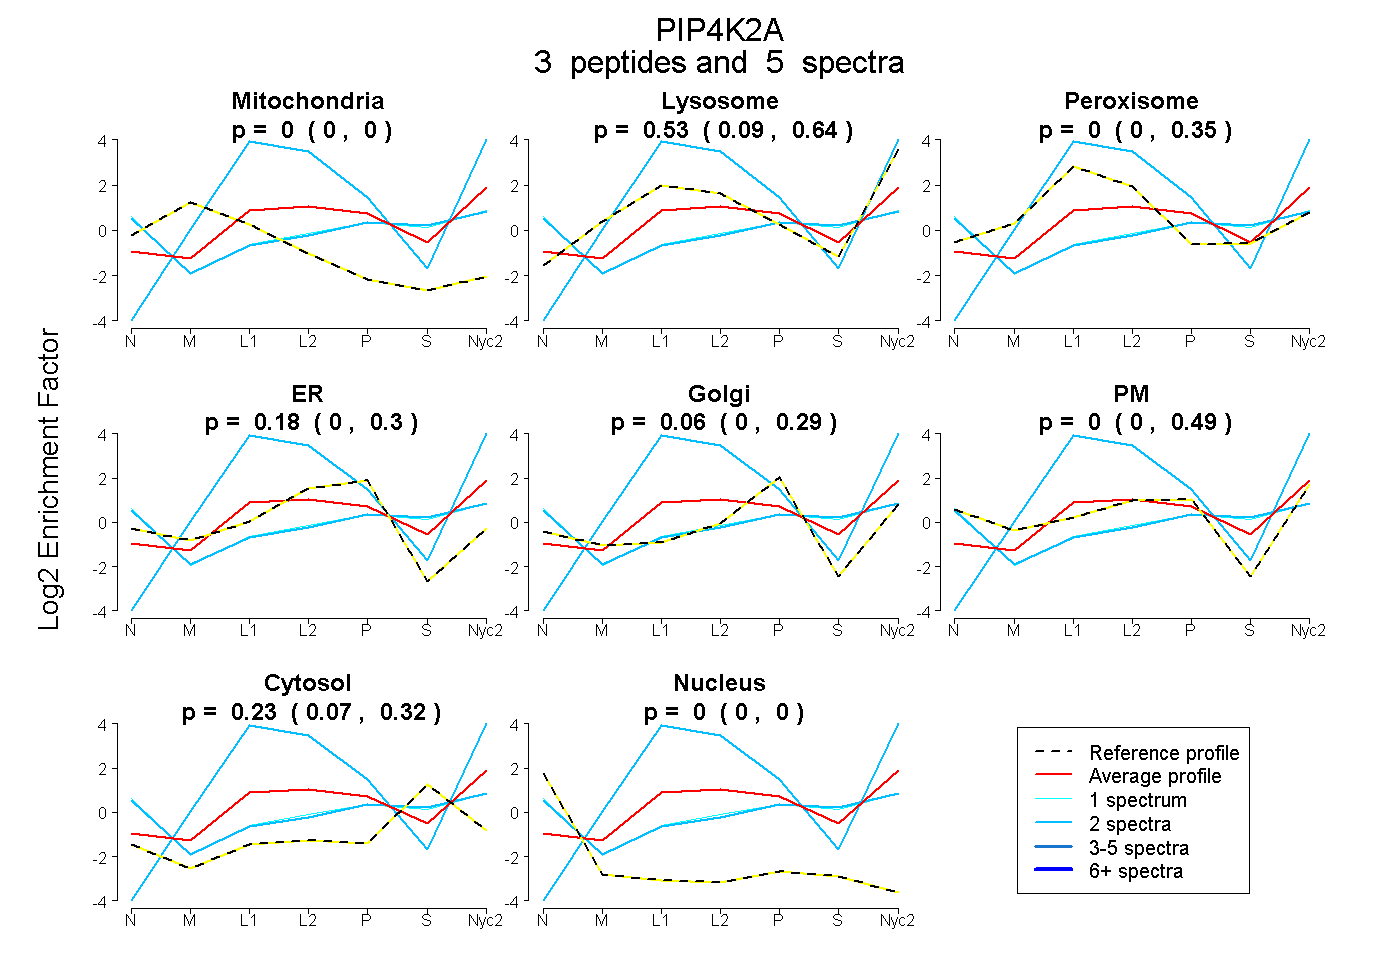
0.000 | 0.000
0.095 | 0.641
0.000 | 0.349
0.000 | 0.297
0.000 | 0.287
0.000 | 0.486
0.065 | 0.315
0.000 | 0.000
1peptide
spectra
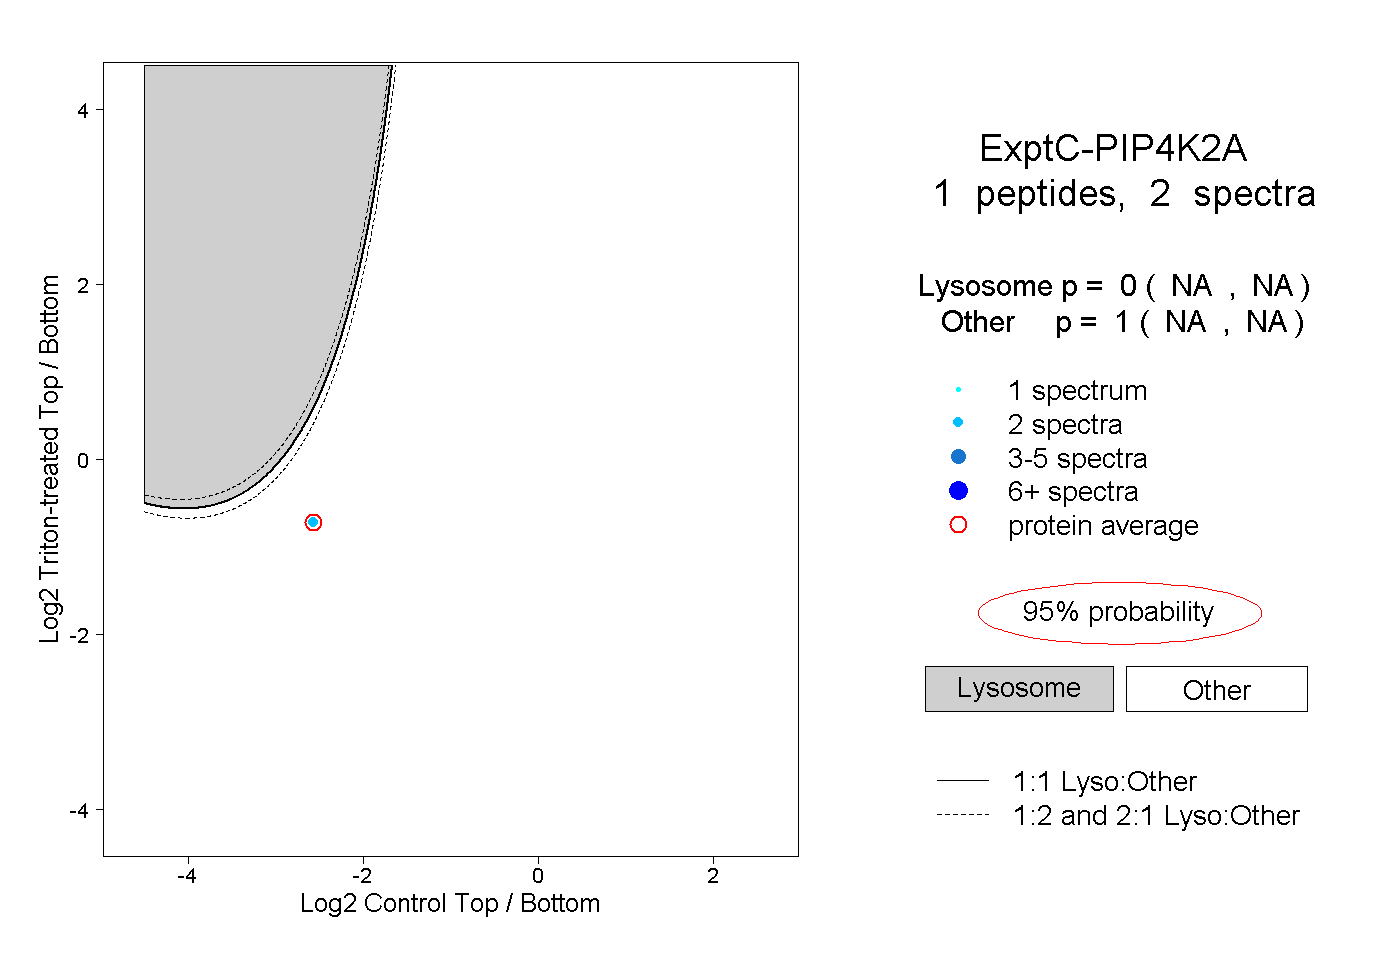
NA | NA
NA | NA
2peptides
spectra
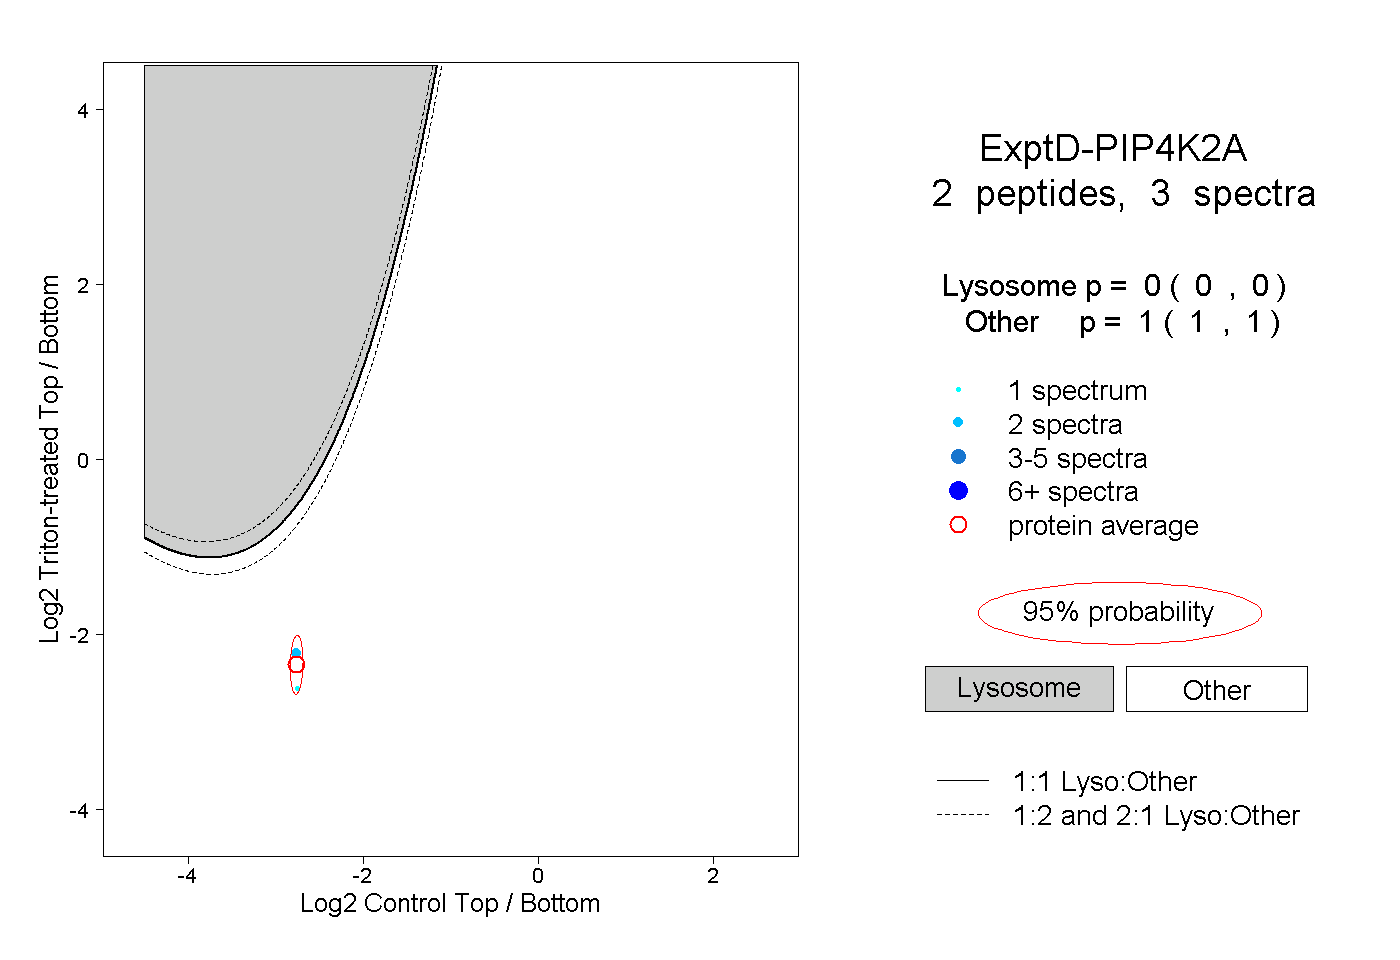
0.000 | 0.000
1.000 | 1.000