 3
3peptides
spectra

0.000 | 0.000
0.000 | 0.000
0.000 | 0.000
0.226 | 0.267
0.000 | 0.000
0.000 | 0.000
0.143 | 0.197
0.559 | 0.597
1peptide
spectra
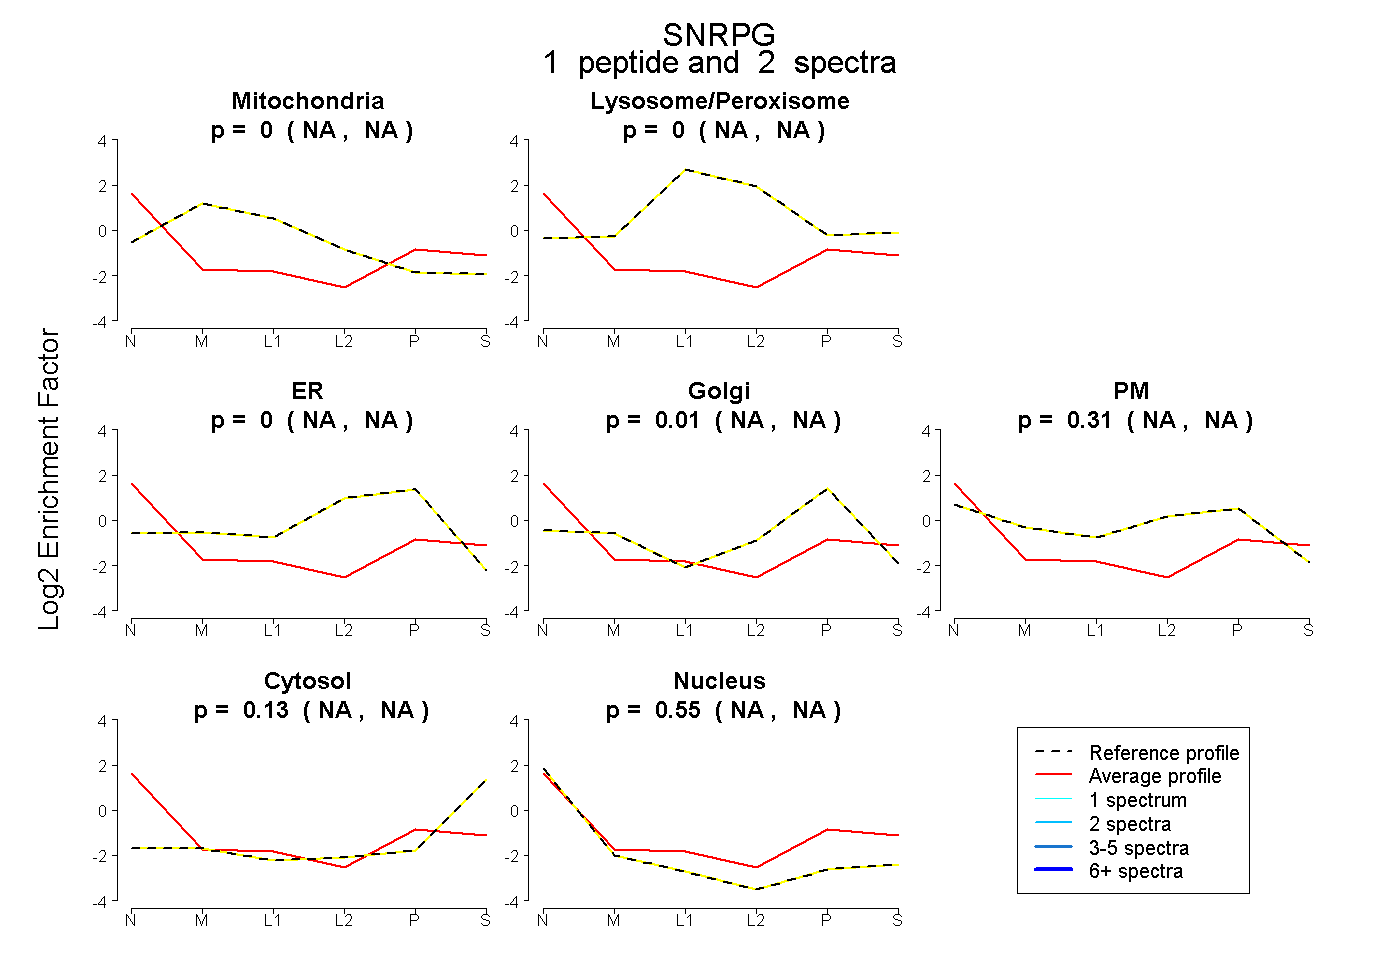
NA | NA
NA | NA
NA | NA
NA | NA
NA | NA
NA | NA
NA | NA
2peptides
spectra
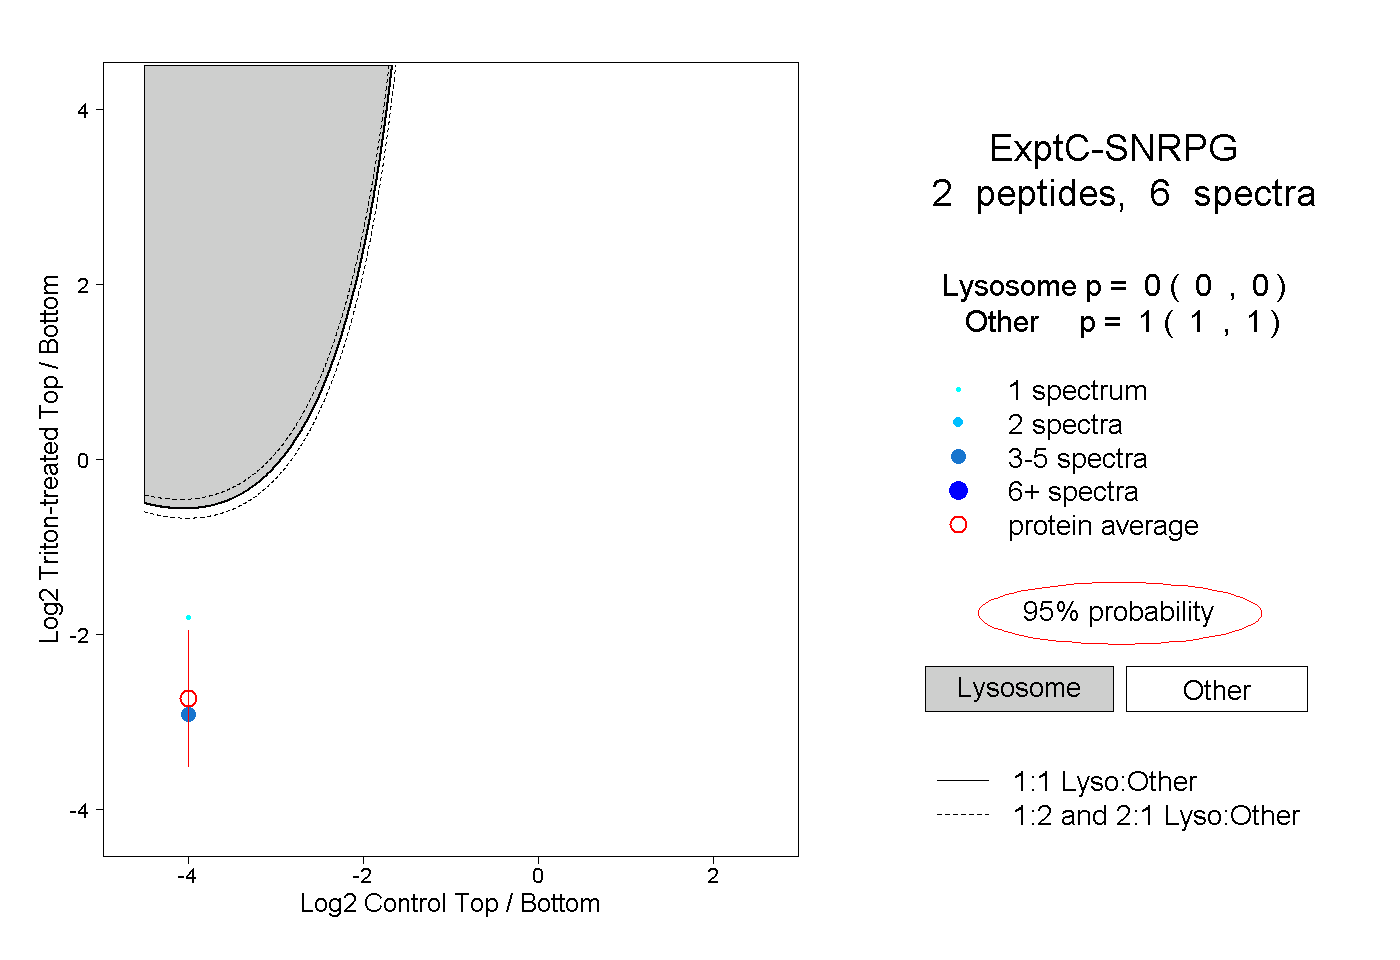
0.000 | 0.000
1.000 | 1.000