 2
2peptides
spectra
0.000 | 0.000
0.027 | 0.137
0.000 | 0.010
0.000 | 0.000
0.000 | 0.000
0.823 | 0.959
0.000 | 0.036
0.000 | 0.000
1peptide
spectrum

NA | NA
NA | NA
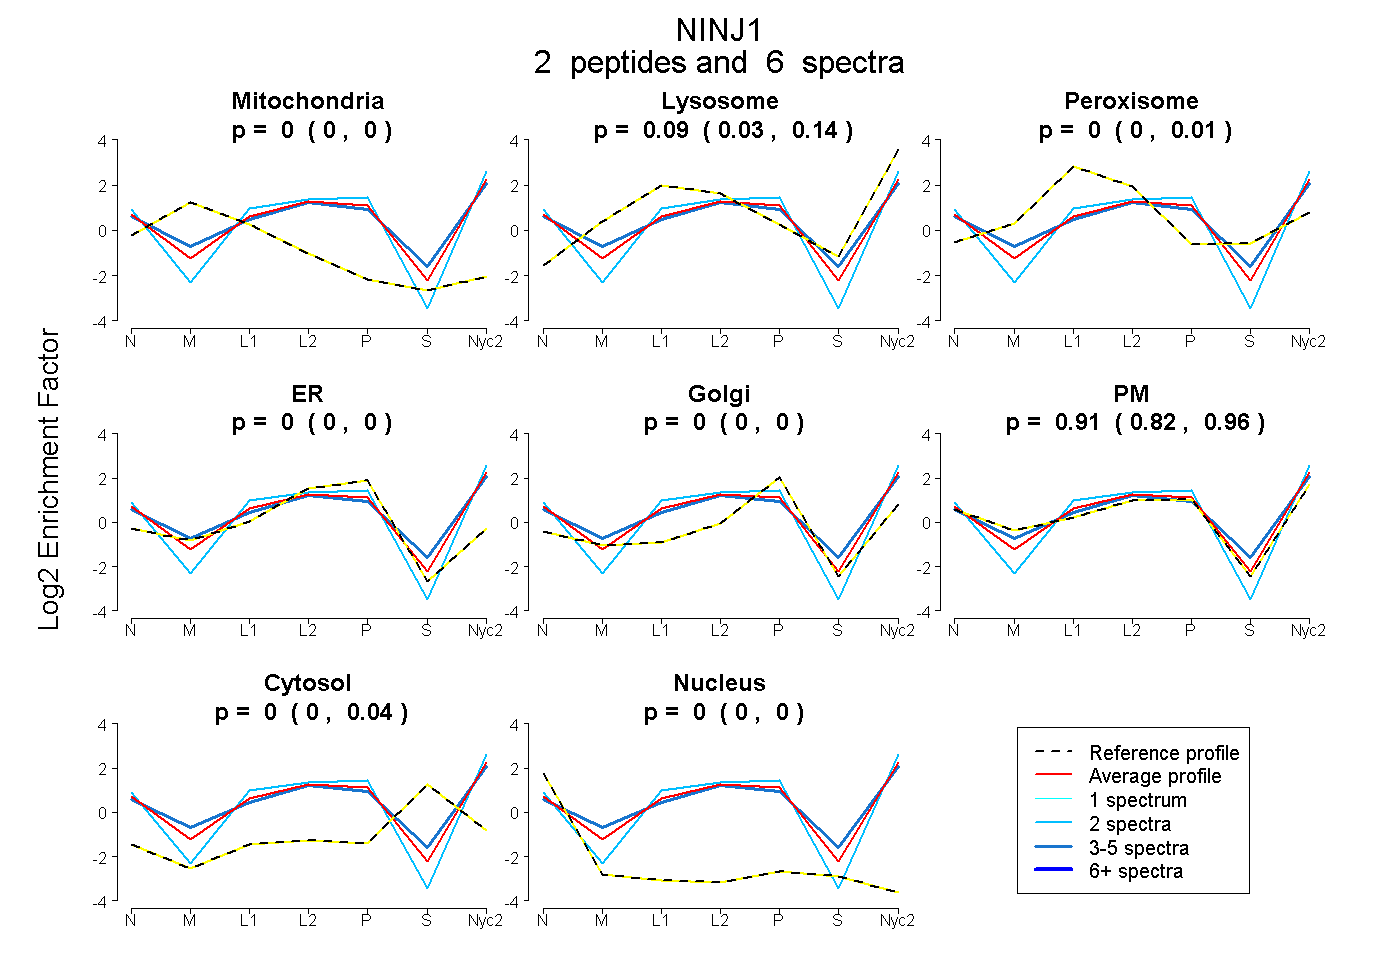
| Plot | Mito | Lyso | Perox | ER | Golgi | PM | Cytosol | Nucleus | |||||
| Expt A |
2 peptides |
6 spectra |
|
0.000 0.000 | 0.000 |
0.088 0.027 | 0.137 |
0.000 0.000 | 0.010 |
0.000 0.000 | 0.000 |
0.000 0.000 | 0.000 |
0.912 0.823 | 0.959 |
0.000 0.000 | 0.036 |
0.000 0.000 | 0.000 |
||
| Plot | Lyso | Other | |||||||||||
| Expt C |
1 peptide |
1 spectrum |
|
0.000 NA | NA |
1.000 NA | NA |