 2
2peptides
spectra
0.000 | 0.000
0.000 | 0.000
0.000 | 0.093
0.171 | 0.490
0.000 | 0.351
0.105 | 0.406
0.048 | 0.217
0.000 | 0.077
3peptides
spectra
0.000 | 0.981
0.016 | 1.000
| Plot | Mito | Lyso | Perox | ER | Golgi | PM | Cytosol | Nucleus | |||||
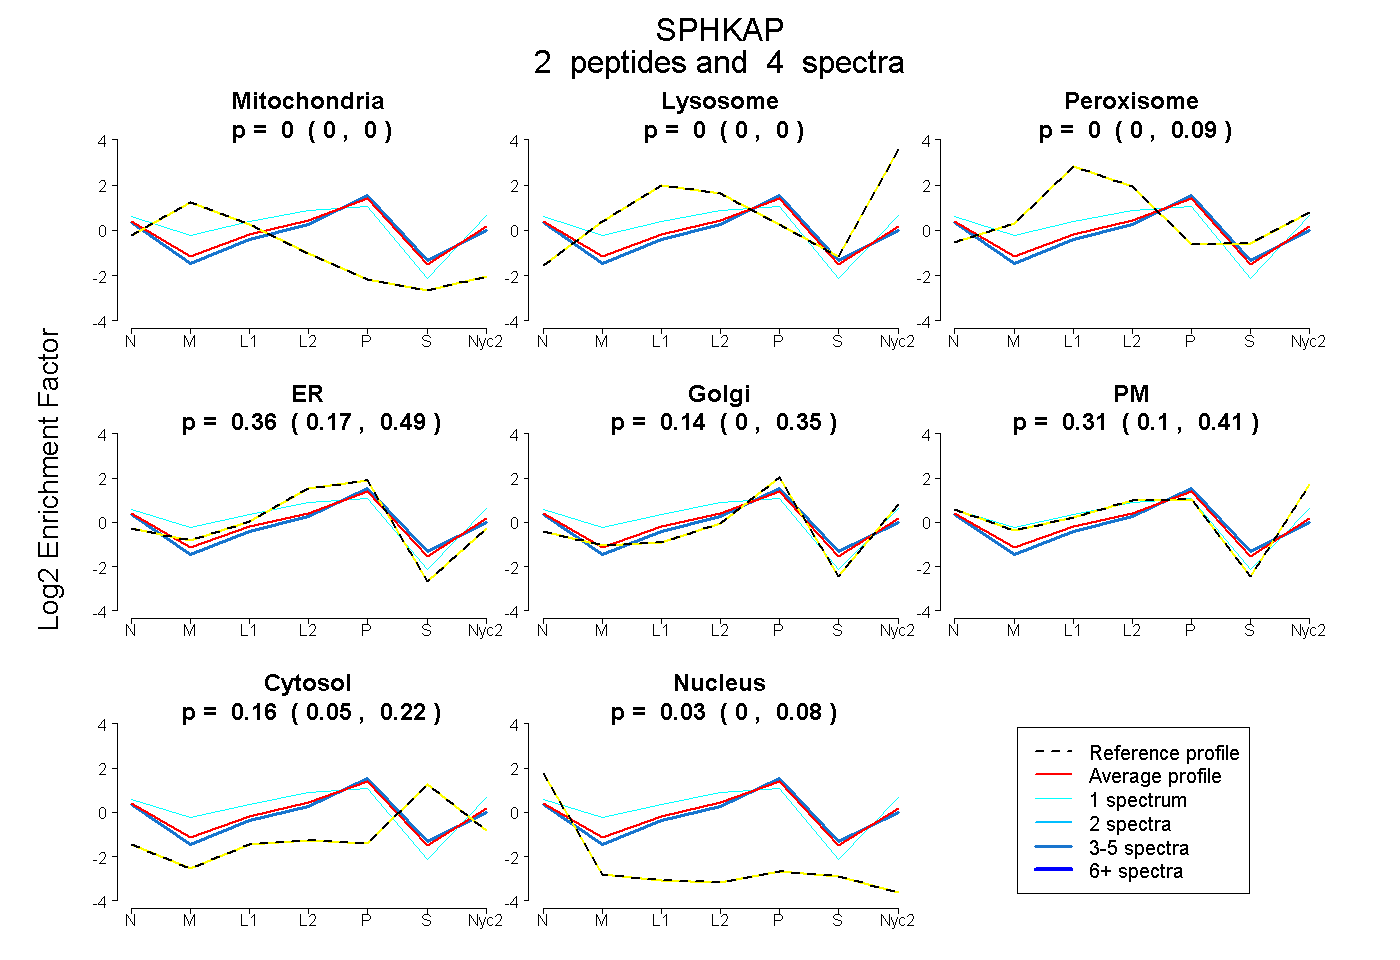
| Expt A |
2 peptides |
4 spectra |
|
0.000 0.000 | 0.000 |
0.000 0.000 | 0.000 |
0.000 0.000 | 0.093 |
0.360 0.171 | 0.490 |
0.143 0.000 | 0.351 |
0.306 0.105 | 0.406 |
0.162 0.048 | 0.217 |
0.028 0.000 | 0.077 |
||
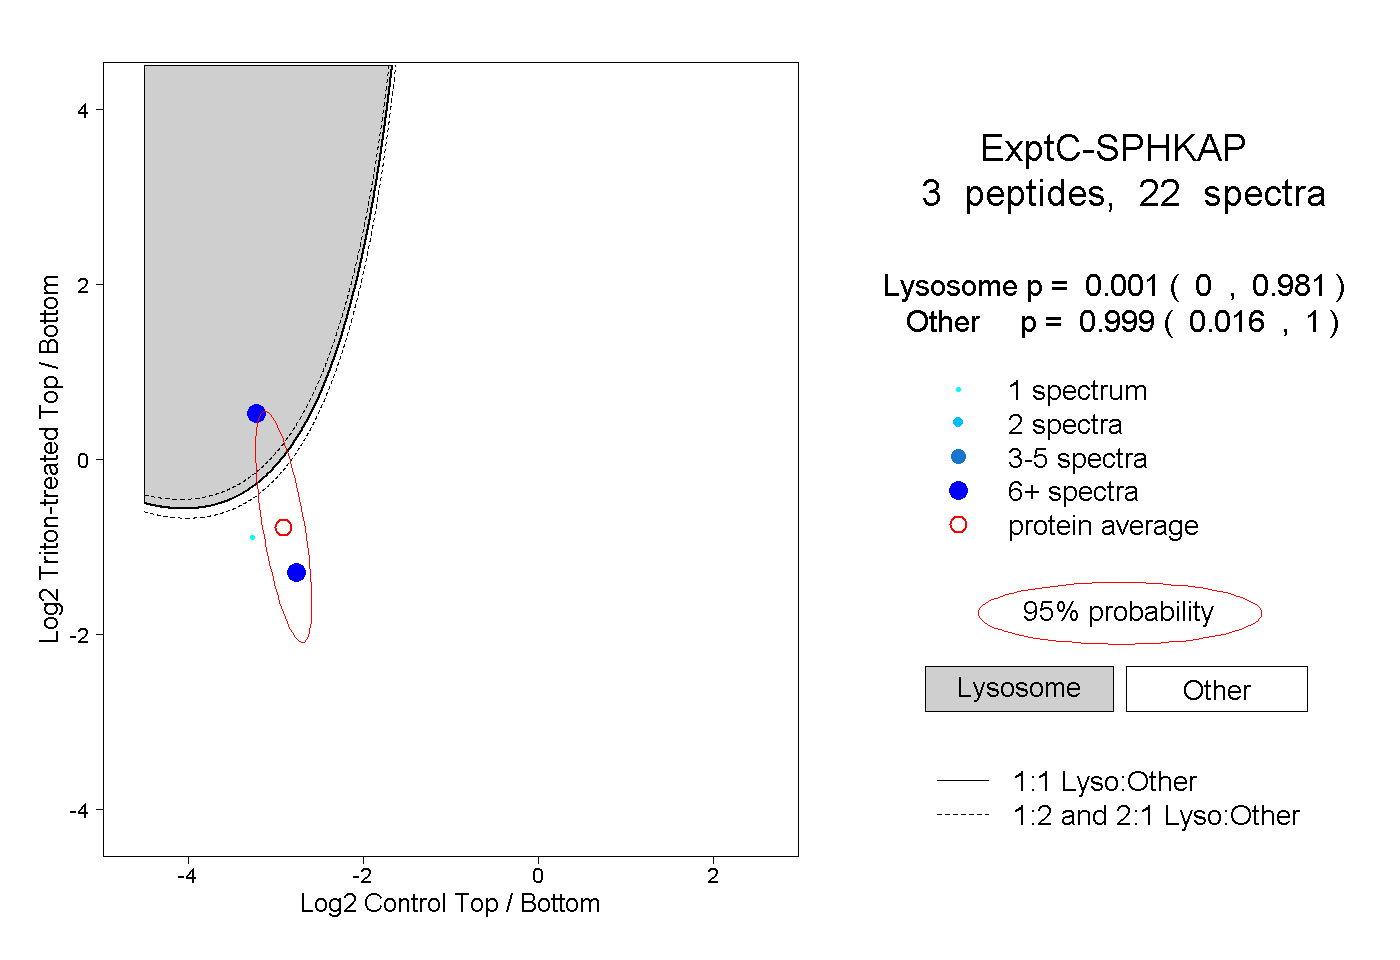
| Plot | Lyso | Other | |||||||||||
| Expt C |
3 peptides |
22 spectra |
|
0.001 0.000 | 0.981 |
0.999 0.016 | 1.000 |