 2
2peptides
spectra
0.000 | 0.120
0.000 | 0.000
0.000 | 0.242
0.000 | 0.461
0.000 | 0.478
0.000 | 0.589
0.000 | 0.354
0.016 | 0.265
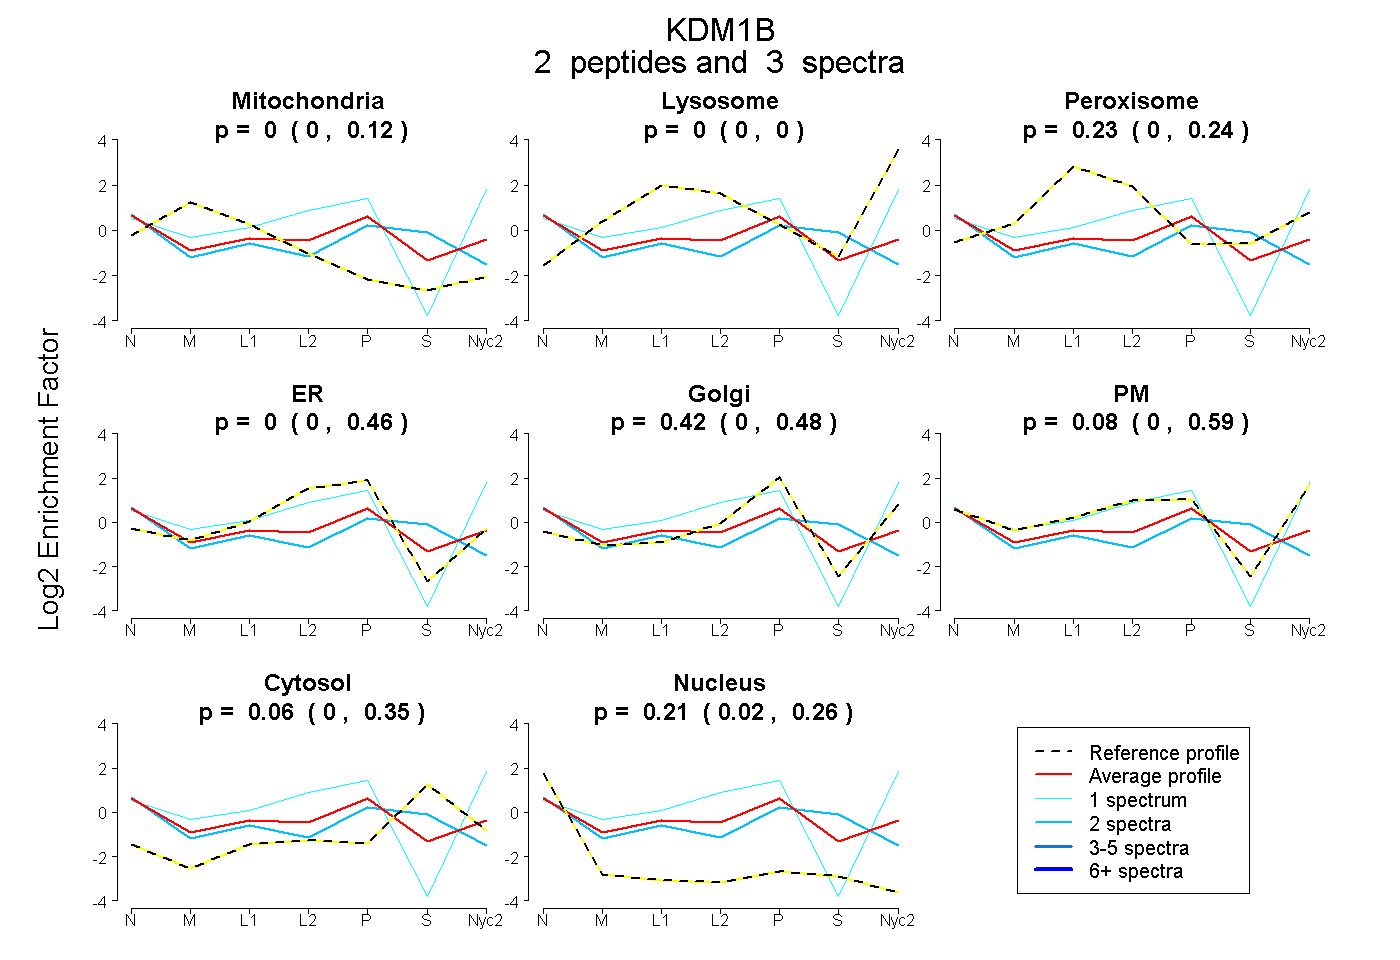
| Plot | Mito | Lyso | Perox | ER | Golgi | PM | Cytosol | Nucleus | |||||
| Expt A |
2 peptides |
3 spectra |
|
0.000 0.000 | 0.120 |
0.000 0.000 | 0.000 |
0.228 0.000 | 0.242 |
0.000 0.000 | 0.461 |
0.418 0.000 | 0.478 |
0.081 0.000 | 0.589 |
0.065 0.000 | 0.354 |
0.208 0.016 | 0.265 |