 11
11peptides
spectra
0.000 | 0.000
0.000 | 0.000
0.000 | 0.000
0.000 | 0.000
0.000 | 0.000
0.000 | 0.000
0.923 | 0.934
0.065 | 0.077
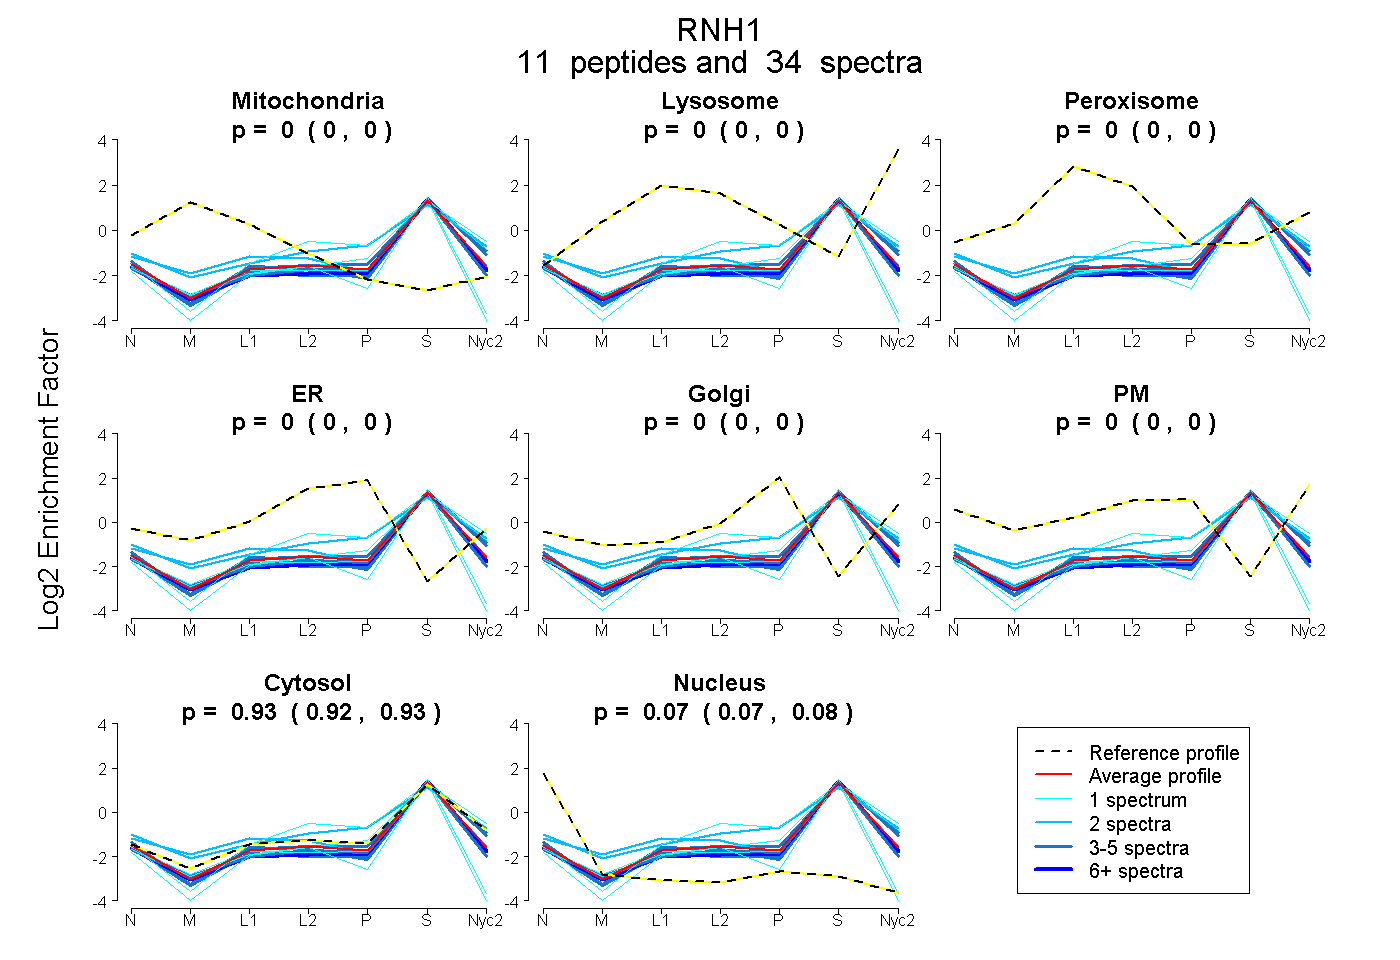
| Plot | Mito | Lyso | Perox | ER | Golgi | PM | Cytosol | Nucleus | |||||
| Expt A |
11 peptides |
34 spectra |
|
0.000 0.000 | 0.000 |
0.000 0.000 | 0.000 |
0.000 0.000 | 0.000 |
0.000 0.000 | 0.000 |
0.000 0.000 | 0.000 |
0.000 0.000 | 0.000 |
0.929 0.923 | 0.934 |
0.071 0.065 | 0.077 |
| 2 spectra, LLCEGLR | 0.000 | 0.000 | 0.000 | 0.052 | 0.066 | 0.018 | 0.865 | 0.000 | ||
| 4 spectra, ALEEERPSLR | 0.000 | 0.000 | 0.000 | 0.000 | 0.000 | 0.000 | 0.910 | 0.090 | ||
| 1 spectrum, TLWLWDCDVTAEGCK | 0.000 | 0.000 | 0.000 | 0.000 | 0.000 | 0.000 | 0.794 | 0.206 | ||
| 4 spectra, LDDCGLTEVR | 0.000 | 0.000 | 0.000 | 0.000 | 0.000 | 0.000 | 0.899 | 0.101 | ||
| 1 spectrum, VKPDFK | 0.000 | 0.000 | 0.000 | 0.064 | 0.000 | 0.000 | 0.936 | 0.000 | ||
| 1 spectrum, SAIQANPALTELSLR | 0.000 | 0.000 | 0.000 | 0.000 | 0.000 | 0.000 | 0.977 | 0.023 | ||
| 1 spectrum, LSLQNCSLTEAGCGVLPDVLR | 0.000 | 0.000 | 0.000 | 0.000 | 0.000 | 0.000 | 0.788 | 0.212 | ||
| 4 spectra, ALGYPDTVLR | 0.000 | 0.000 | 0.000 | 0.000 | 0.000 | 0.000 | 0.942 | 0.058 | ||
| 2 spectra, DLCDVVASK | 0.118 | 0.000 | 0.000 | 0.000 | 0.000 | 0.000 | 0.872 | 0.010 | ||
| 4 spectra, ASLQELDLGSNK | 0.000 | 0.000 | 0.000 | 0.000 | 0.000 | 0.000 | 0.971 | 0.029 | ||
| 10 spectra, DSACQLESLK | 0.000 | 0.000 | 0.000 | 0.000 | 0.000 | 0.000 | 0.901 | 0.099 |
| Plot | Mito | Lyso or Perox | ER | Golgi | PM | Cytosol | Nucleus | ||||||
| Expt B |
7 peptides |
20 spectra |
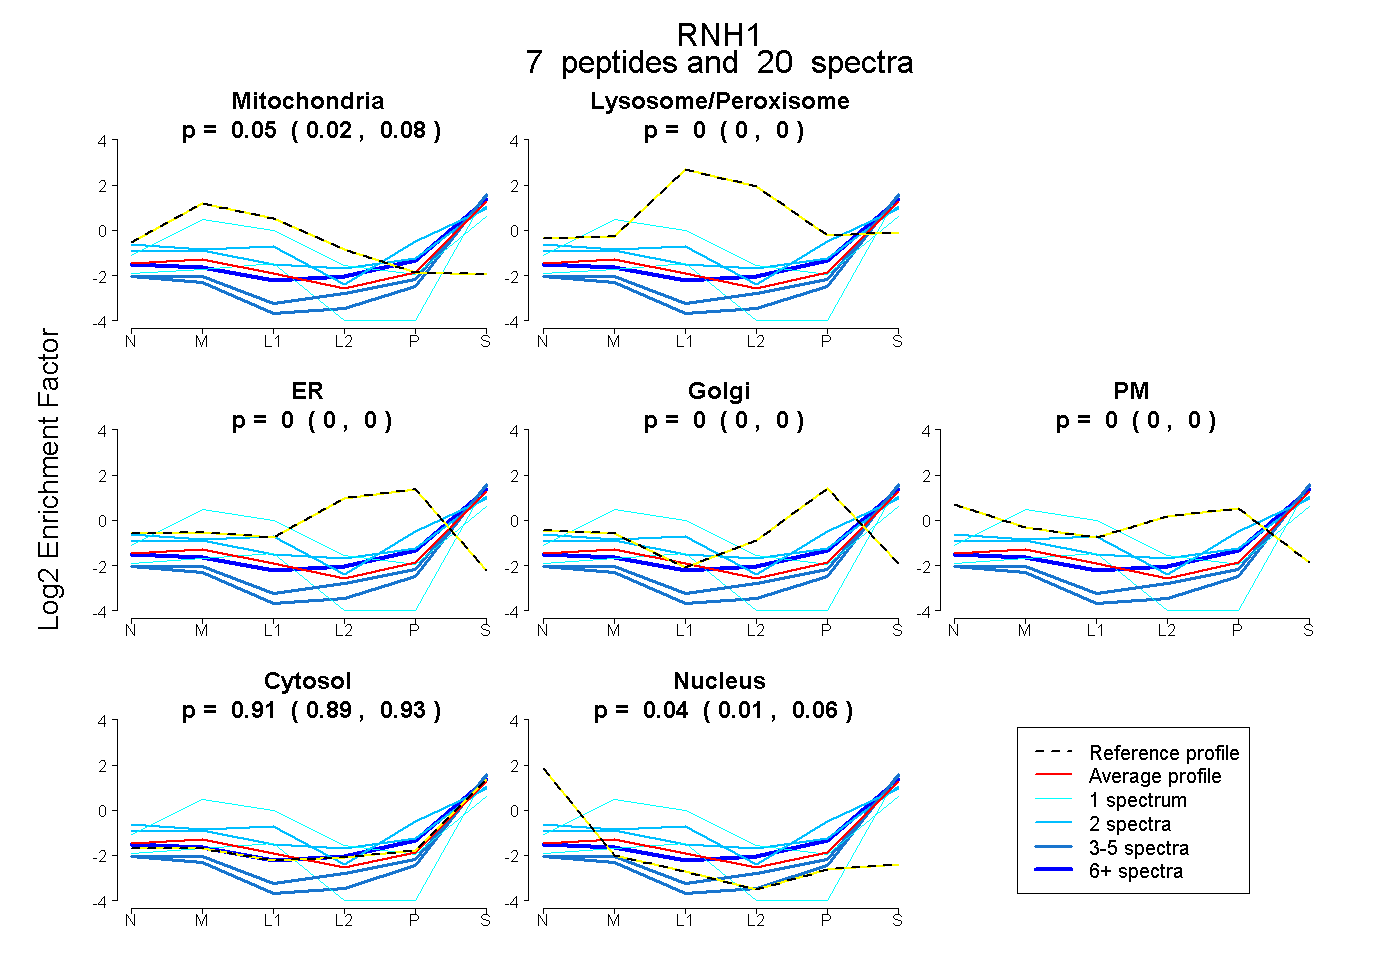 |
0.050 0.017 | 0.079 |
0.000 0.000 | 0.000 |
0.000 0.000 | 0.000 |
0.000 0.000 | 0.000 |
0.000 0.000 | 0.000 |
0.914 0.894 | 0.932 |
0.036 0.009 | 0.057 |
|||
| Plot | Lyso | Other | |||||||||||
| Expt C |
11 peptides |
34 spectra |
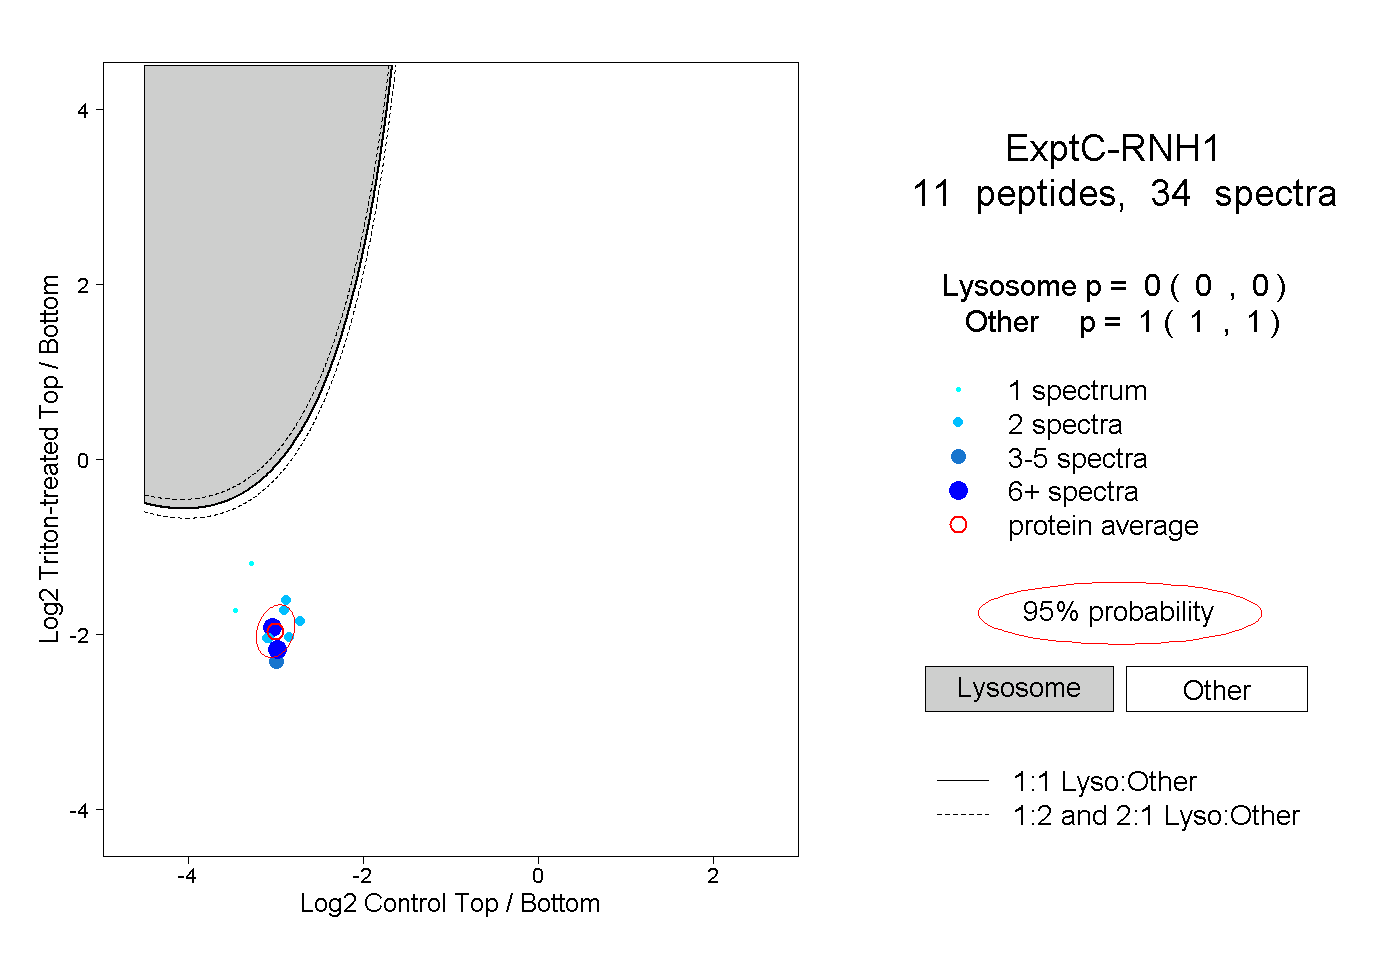 |
0.000 0.000 | 0.000 |
1.000 1.000 | 1.000 |
||||||||
| Plot | Lyso | Other | |||||||||||
| Expt D |
3 peptides |
7 spectra |
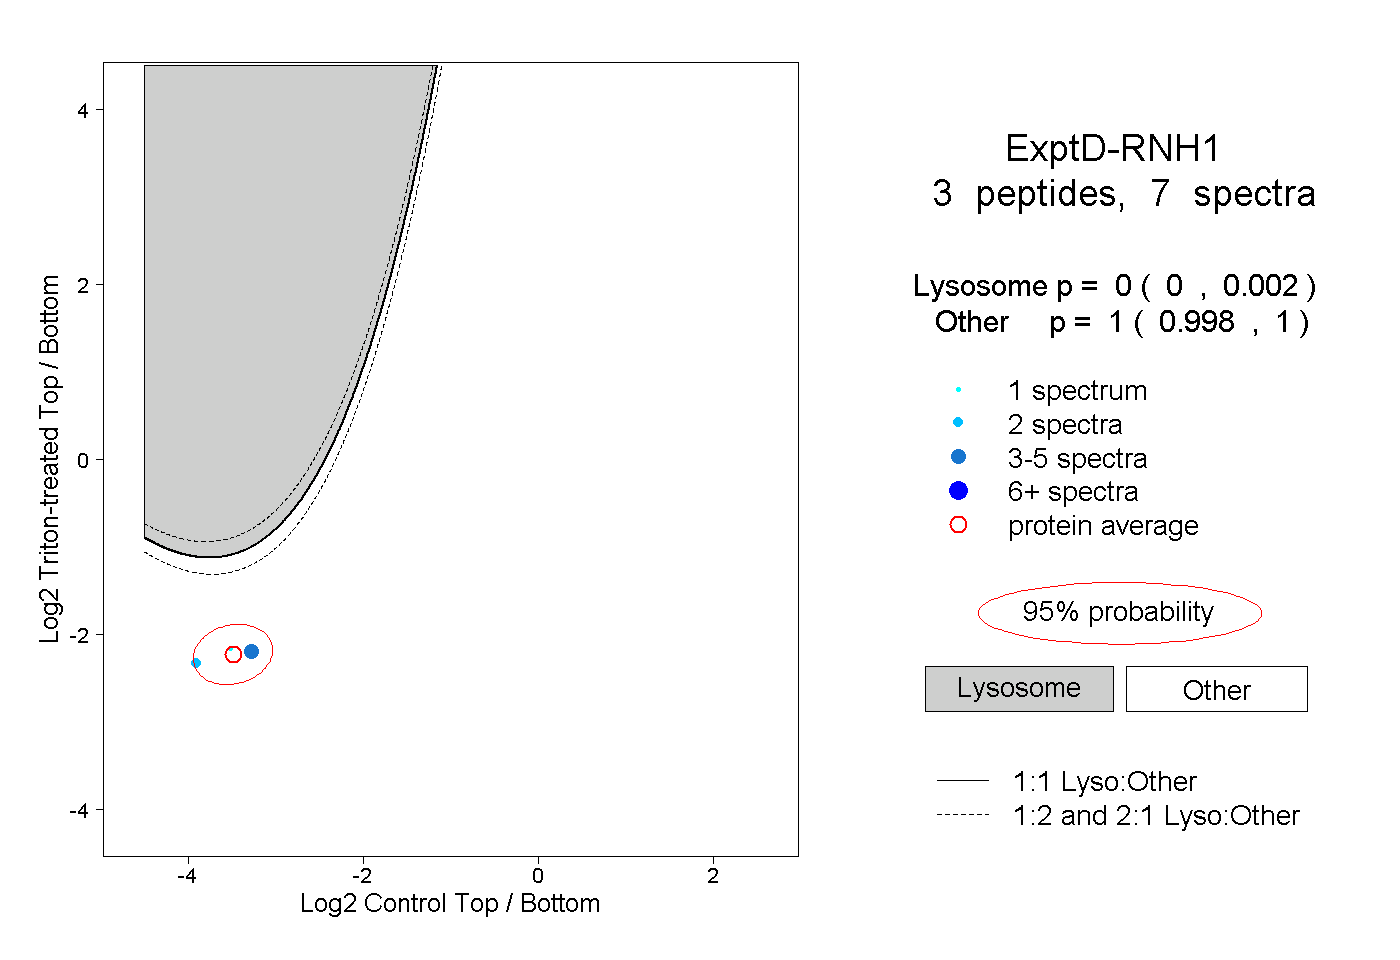 |
0.000 0.000 | 0.002 |
1.000 0.998 | 1.000 |