 6
6peptides
spectra
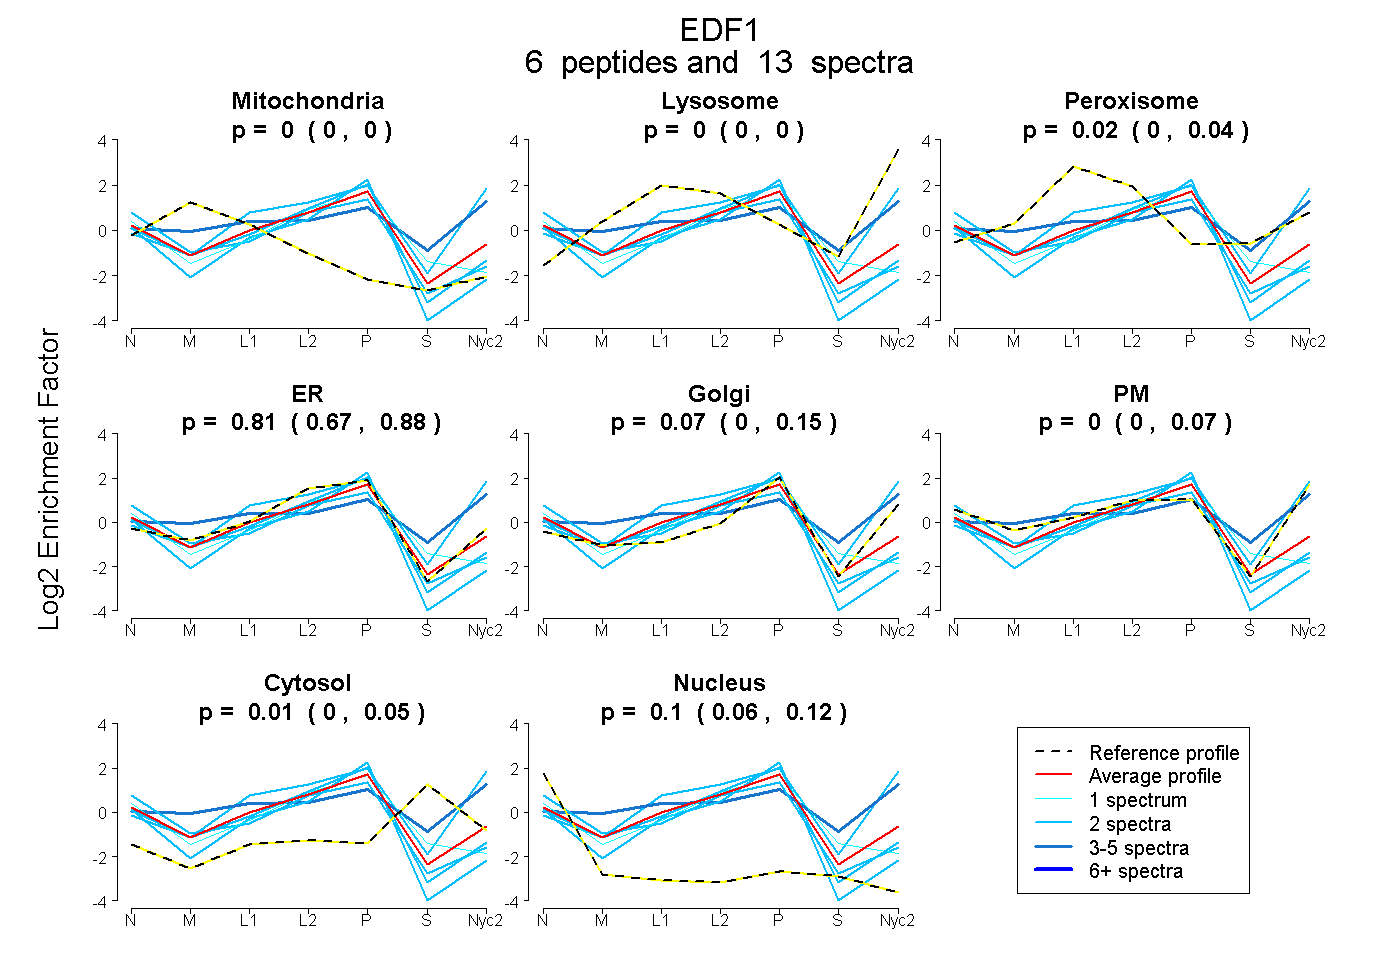
0.000 | 0.000
0.000 | 0.000
0.000 | 0.044
0.671 | 0.880
0.000 | 0.154
0.000 | 0.067
0.000 | 0.049
0.061 | 0.116
4peptides
spectra
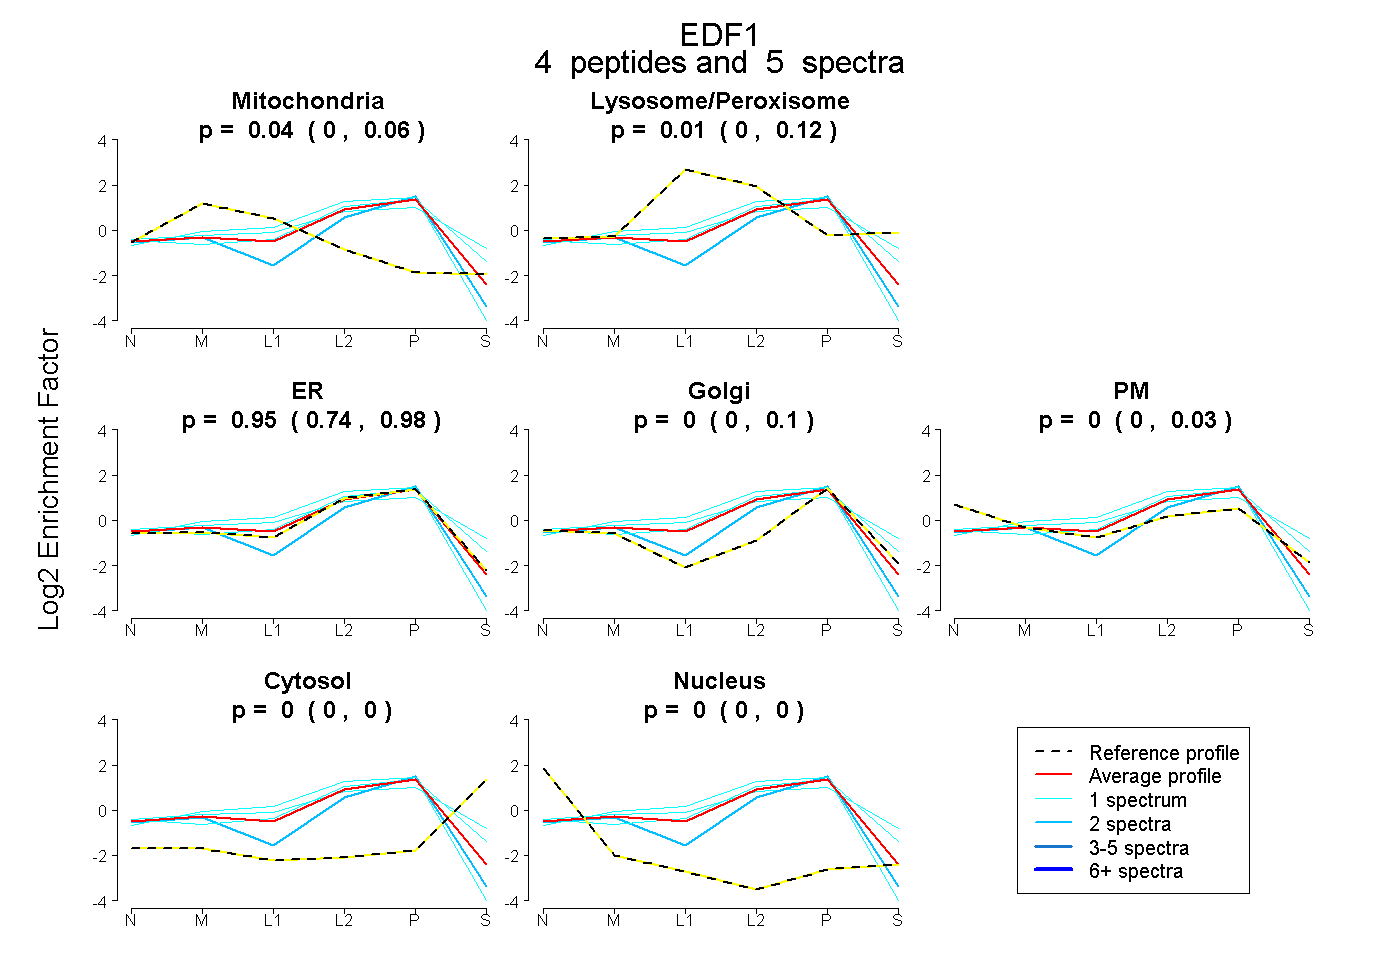
0.000 | 0.061
0.000 | 0.117
0.736 | 0.977
0.000 | 0.100
0.000 | 0.033
0.000 | 0.000
0.000 | 0.000
7peptides
spectra
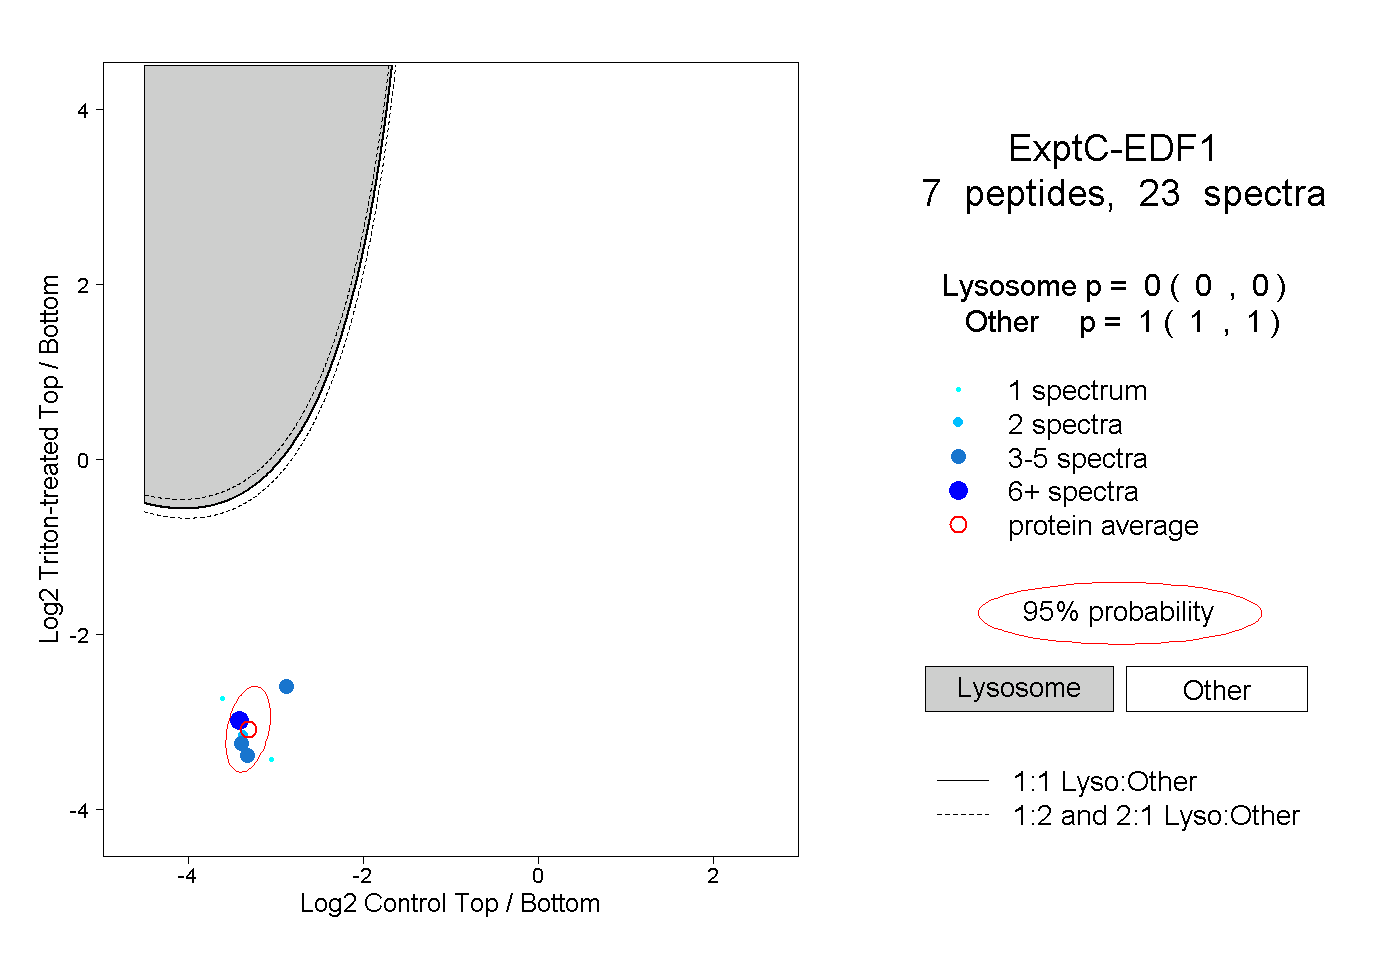
0.000 | 0.000
1.000 | 1.000
