 9
9peptides
spectra
0.000 | 0.000
0.000 | 0.000
0.000 | 0.000
0.290 | 0.381
0.000 | 0.000
0.168 | 0.267
0.406 | 0.427
0.010 | 0.031
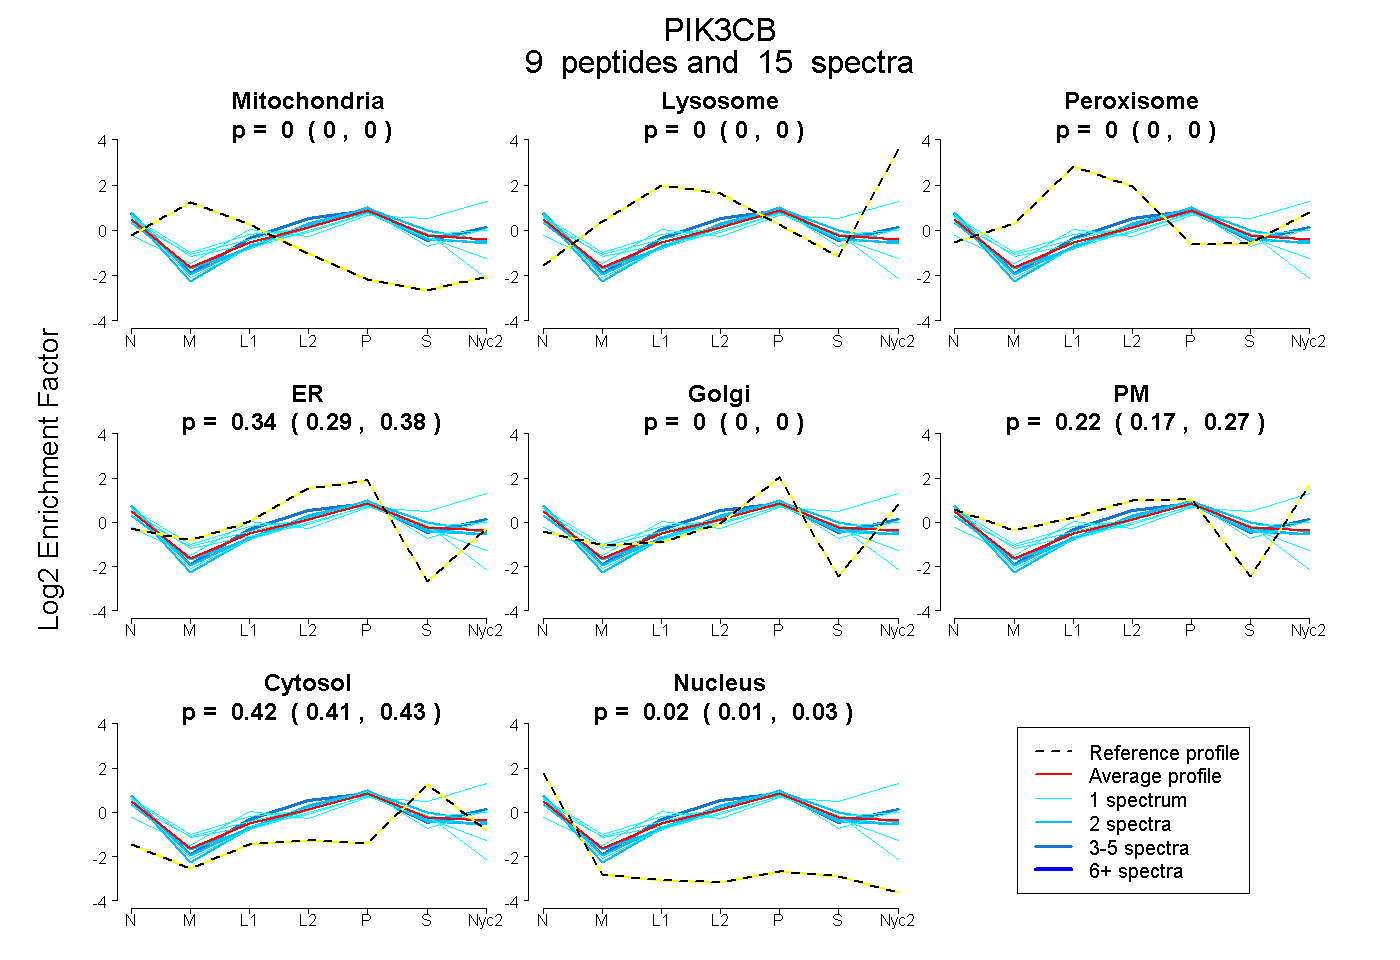
| Plot | Mito | Lyso | Perox | ER | Golgi | PM | Cytosol | Nucleus | |||||
| Expt A |
9 peptides |
15 spectra |
|
0.000 0.000 | 0.000 |
0.000 0.000 | 0.000 |
0.000 0.000 | 0.000 |
0.339 0.290 | 0.381 |
0.000 0.000 | 0.000 |
0.221 0.168 | 0.267 |
0.418 0.406 | 0.427 |
0.022 0.010 | 0.031 |
| 2 spectra, EYNSGDDLDR | 0.000 | 0.000 | 0.000 | 0.409 | 0.036 | 0.099 | 0.397 | 0.059 | ||
| 4 spectra, DALLNWLK | 0.000 | 0.000 | 0.000 | 0.245 | 0.000 | 0.383 | 0.372 | 0.000 | ||
| 1 spectrum, YEPFLDCALSR | 0.000 | 0.000 | 0.057 | 0.479 | 0.000 | 0.000 | 0.348 | 0.116 | ||
| 1 spectrum, MKPLWLVYSNR | 0.000 | 0.000 | 0.016 | 0.231 | 0.000 | 0.354 | 0.399 | 0.000 | ||
| 2 spectra, EALELLDFNYPDQYVR | 0.000 | 0.000 | 0.000 | 0.369 | 0.000 | 0.185 | 0.369 | 0.078 | ||
| 1 spectrum, QCCEDAYLILR | 0.000 | 0.000 | 0.000 | 0.451 | 0.000 | 0.000 | 0.381 | 0.168 | ||
| 2 spectra, LMDLLWK | 0.000 | 0.000 | 0.000 | 0.423 | 0.000 | 0.118 | 0.460 | 0.000 | ||
| 1 spectrum, VEYVFGDHPLIQFQYIR | 0.000 | 0.000 | 0.022 | 0.200 | 0.000 | 0.453 | 0.295 | 0.031 | ||
| 1 spectrum, DIQYLK | 0.000 | 0.227 | 0.000 | 0.000 | 0.074 | 0.242 | 0.457 | 0.000 |
| Plot | Mito | Lyso or Perox | ER | Golgi | PM | Cytosol | Nucleus | ||||||
| Expt B |
4 peptides |
4 spectra |
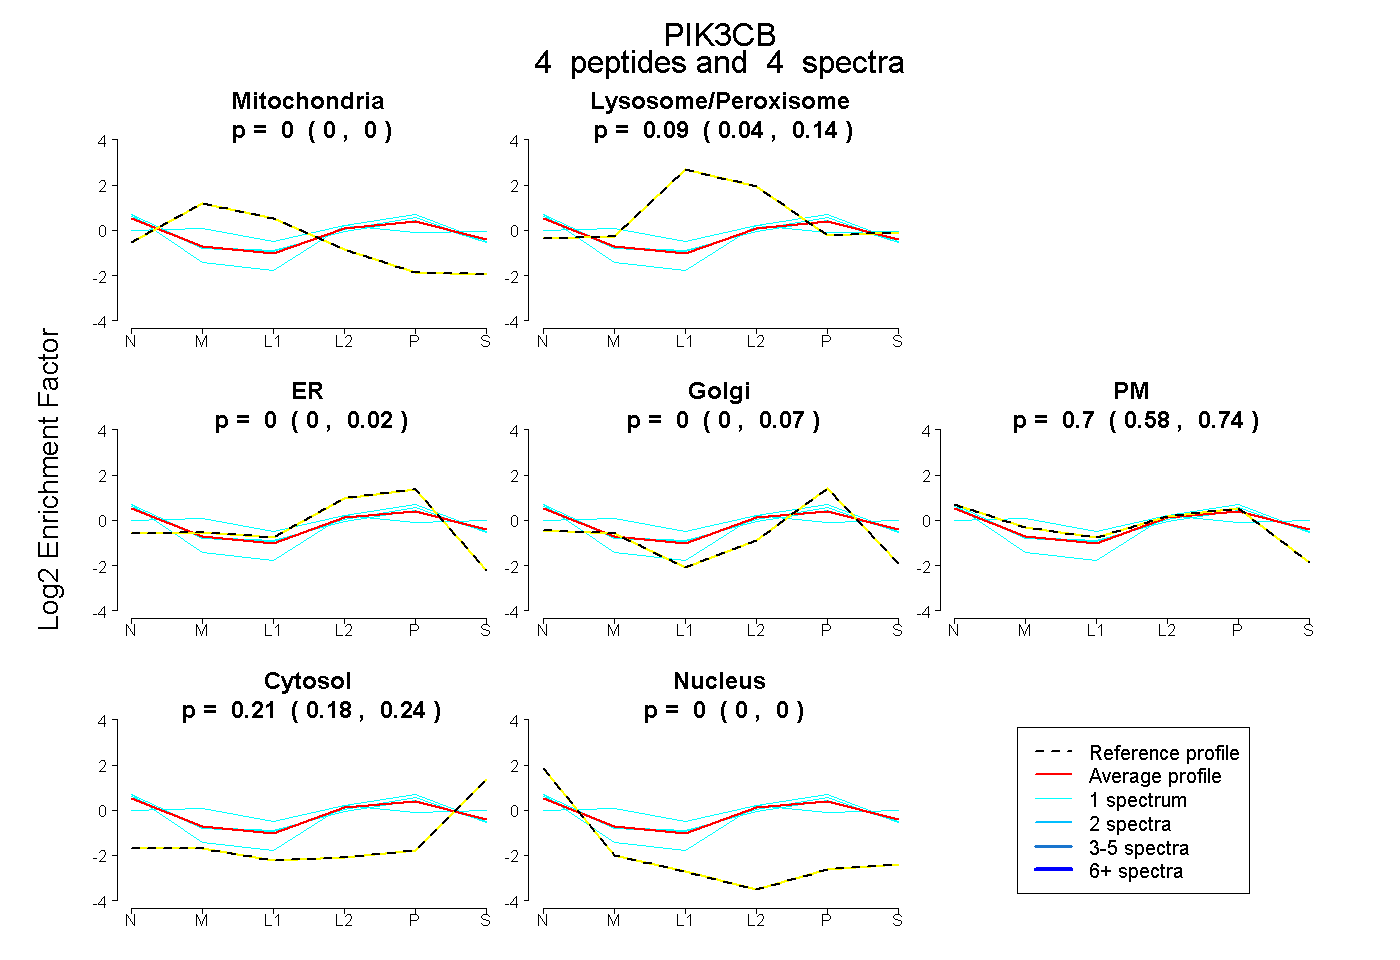 |
0.000 0.000 | 0.000 |
0.088 0.040 | 0.138 |
0.000 0.000 | 0.016 |
0.000 0.000 | 0.068 |
0.700 0.579 | 0.736 |
0.213 0.178 | 0.237 |
0.000 0.000 | 0.000 |
|||
| Plot | Lyso | Other | |||||||||||
| Expt C |
8 peptides |
14 spectra |
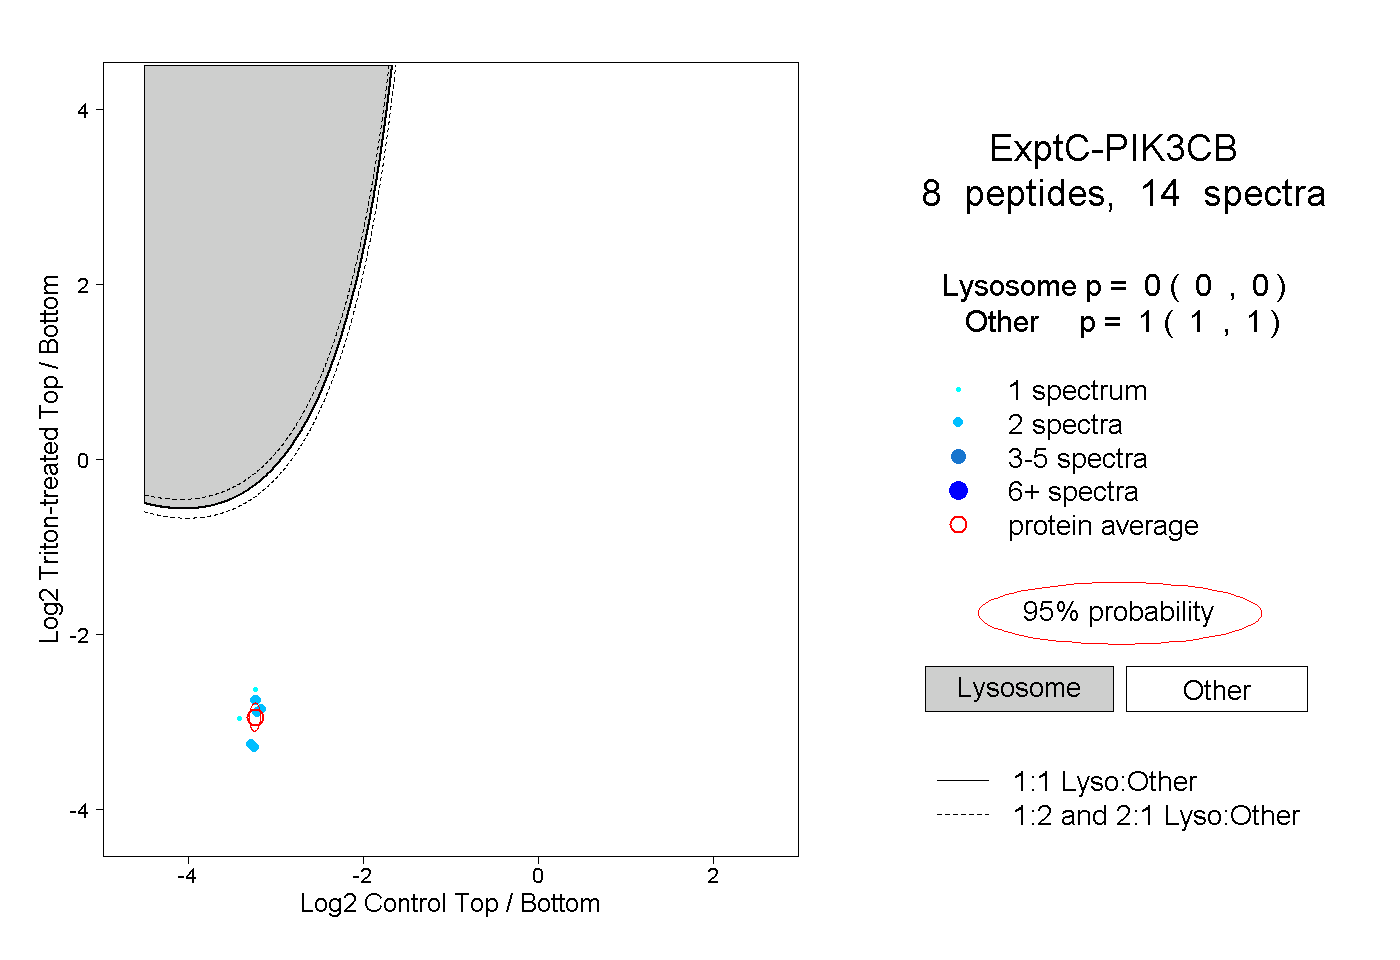 |
0.000 0.000 | 0.000 |
1.000 1.000 | 1.000 |
||||||||
| Plot | Lyso | Other | |||||||||||
| Expt D |
4 peptides |
4 spectra |
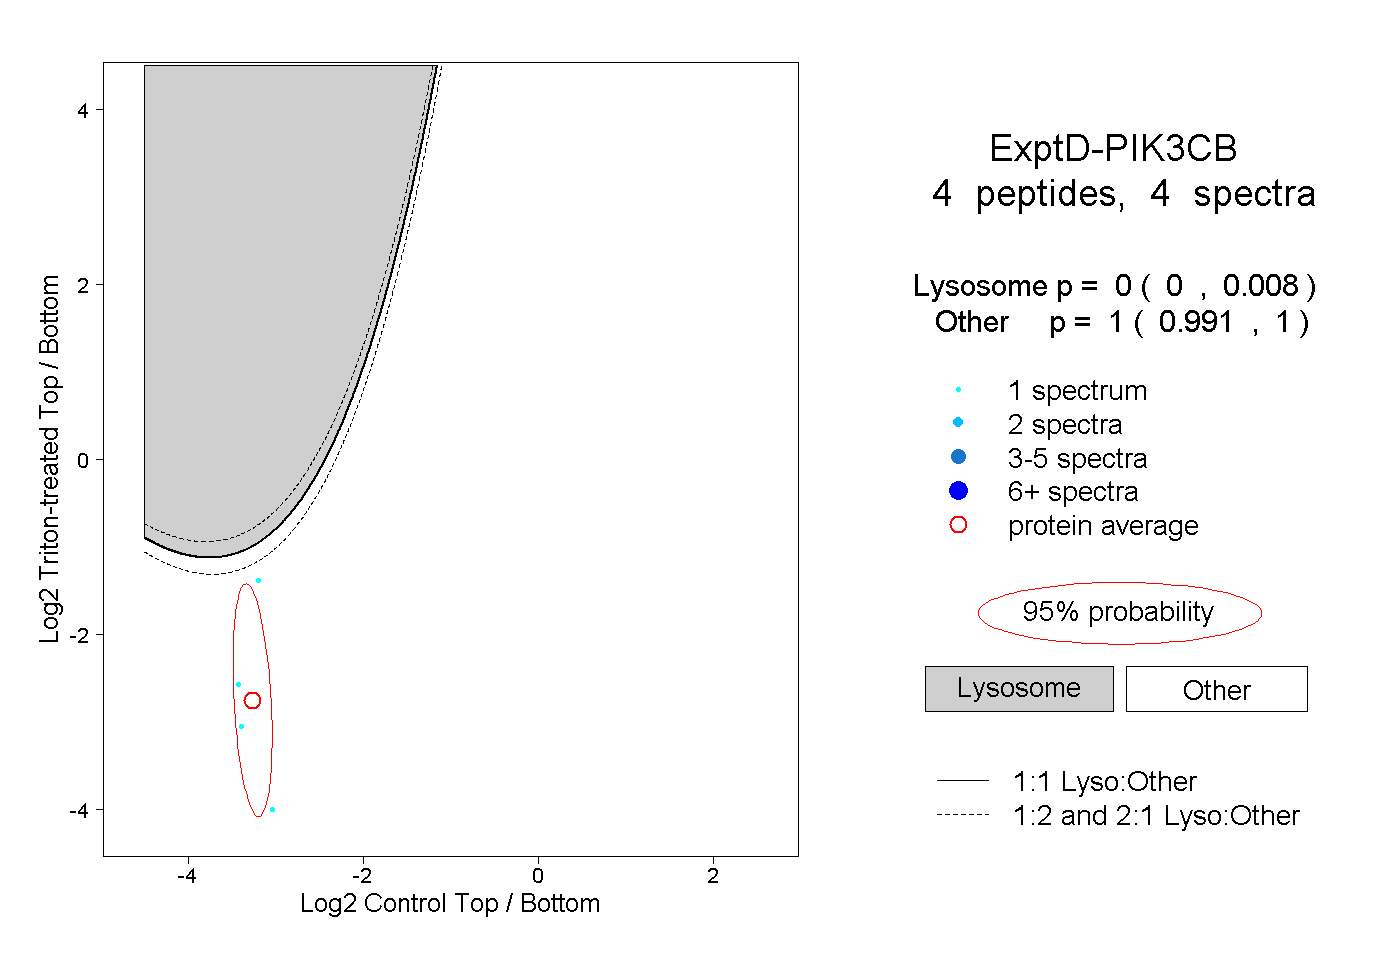 |
0.000 0.000 | 0.008 |
1.000 0.991 | 1.000 |