11
11peptides
spectra
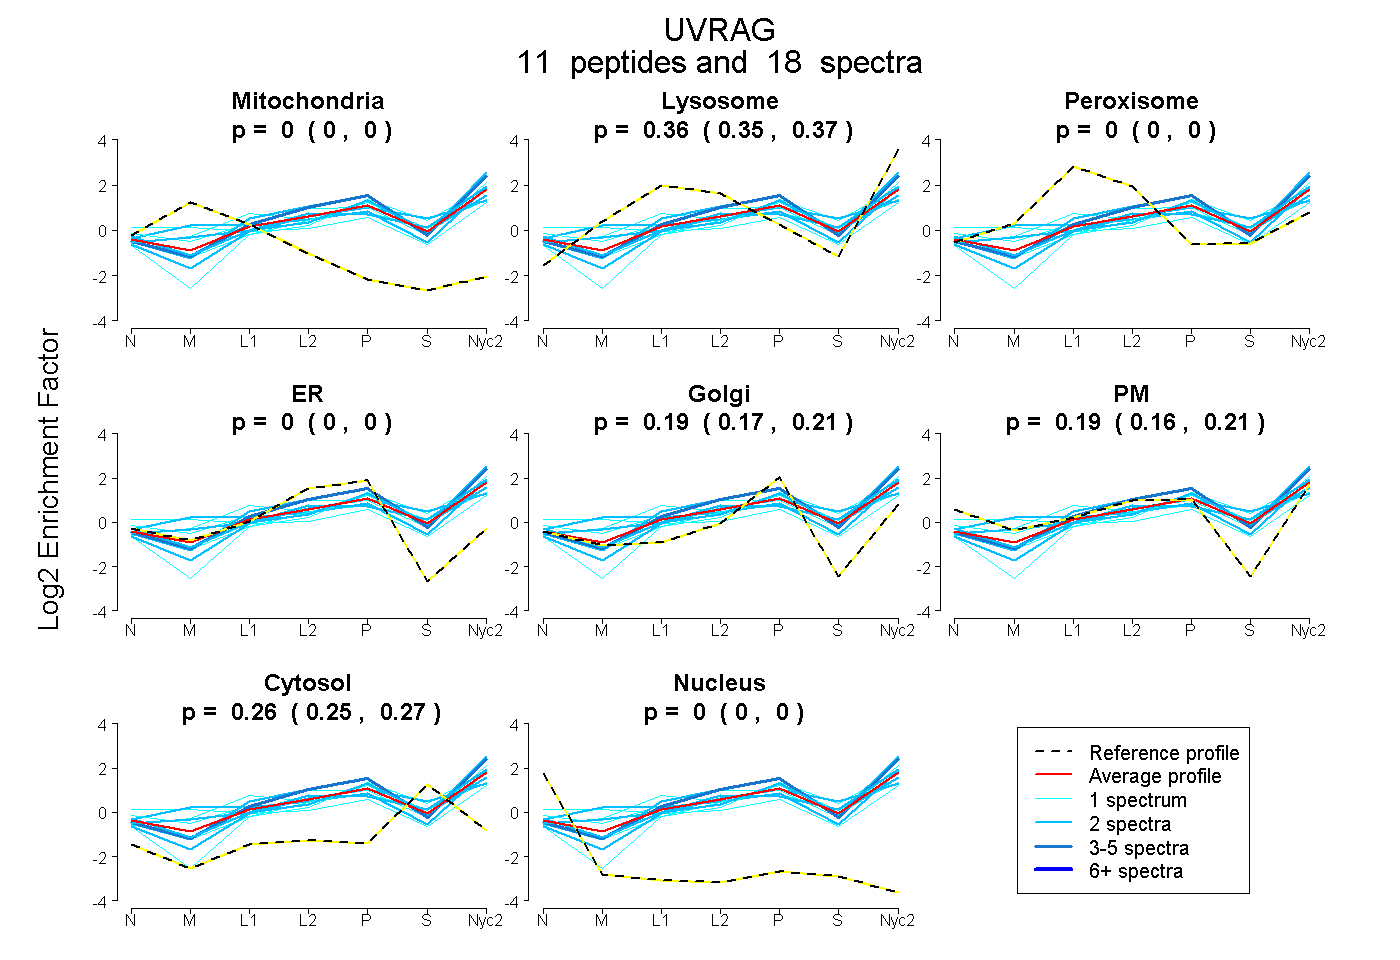
0.000 | 0.000
0.349 | 0.374
0.000 | 0.000
0.000 | 0.000
0.170 | 0.212
0.163 | 0.206
0.248 | 0.267
0.000 | 0.000
2peptides
spectra
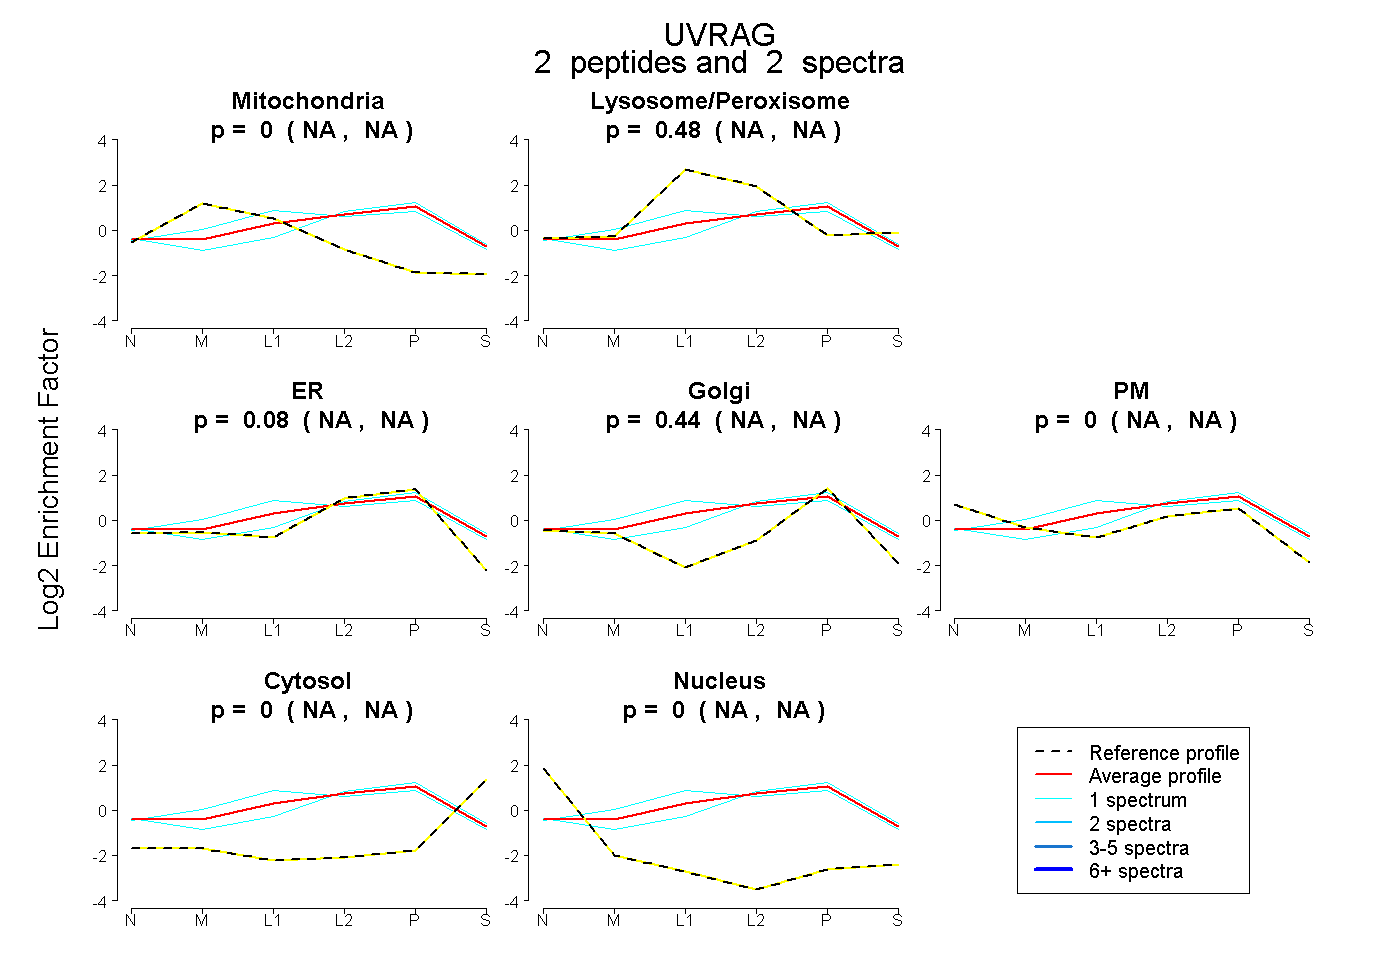
NA | NA
NA | NA
NA | NA
NA | NA
NA | NA
NA | NA
NA | NA
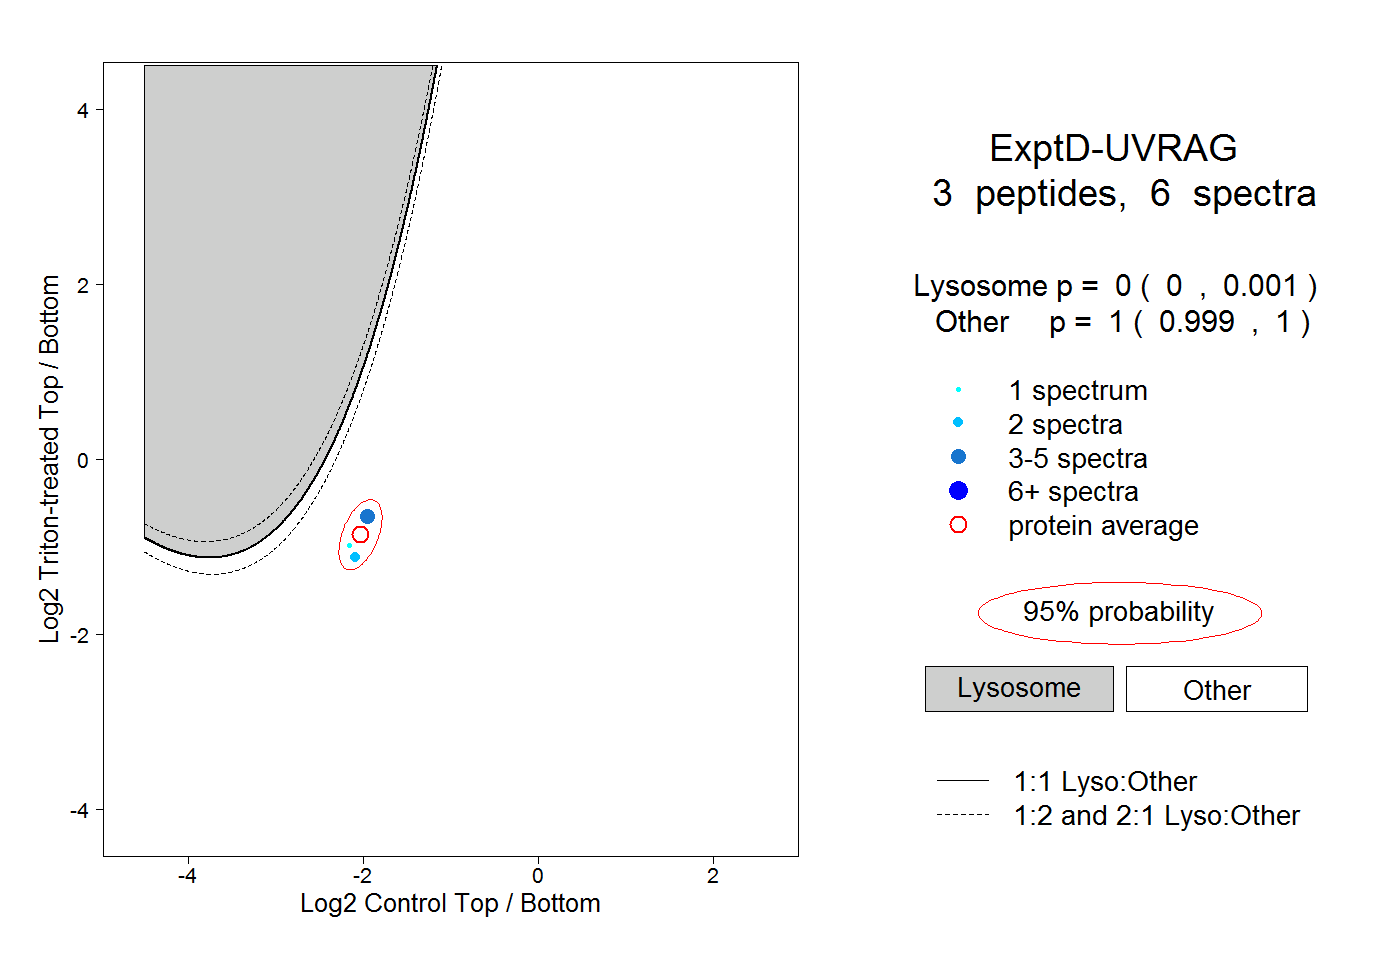
17peptides
spectra
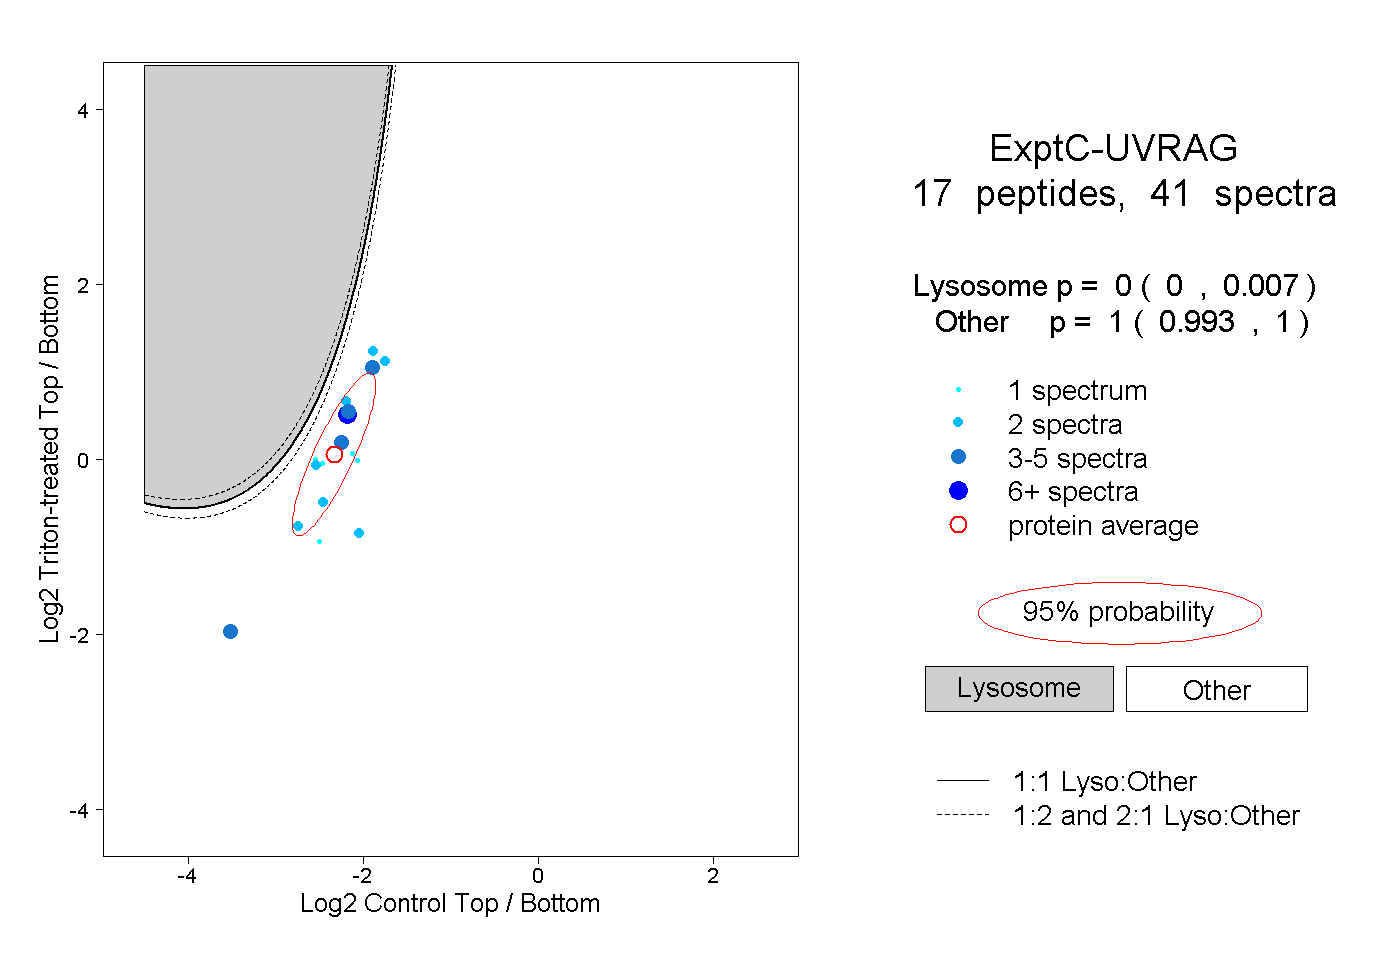
0.000 | 0.007
0.993 | 1.000