 11
11peptides
spectra
0.000 | 0.000
0.349 | 0.374
0.000 | 0.000
0.000 | 0.000
0.170 | 0.212
0.163 | 0.206
0.248 | 0.267
0.000 | 0.000
| Plot | Mito | Lyso | Perox | ER | Golgi | PM | Cytosol | Nucleus | |||||
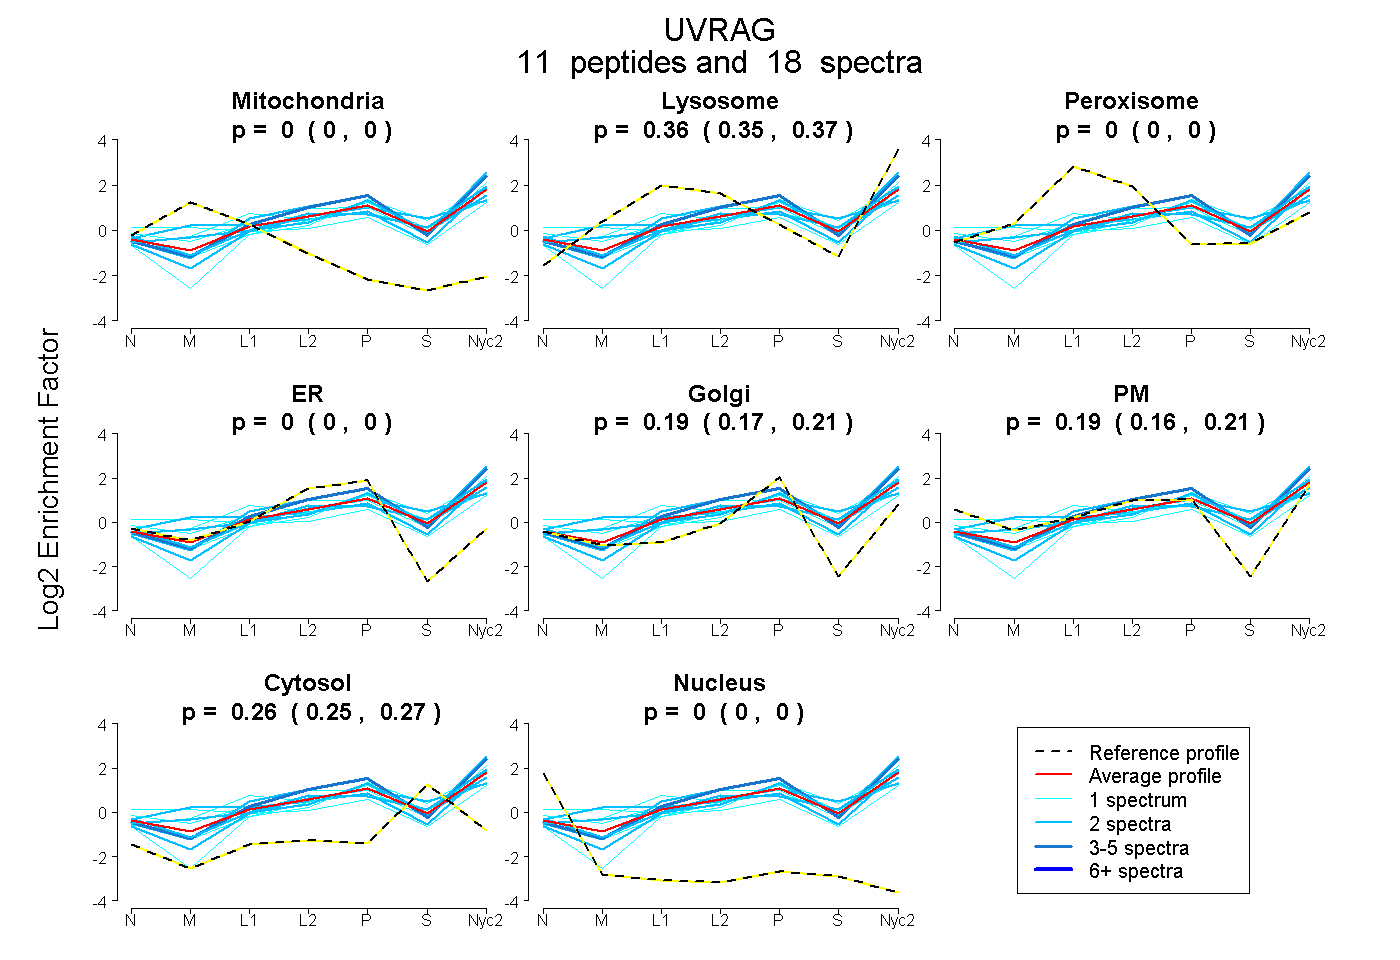
| Expt A |
11 peptides |
18 spectra |
|
0.000 0.000 | 0.000 |
0.363 0.349 | 0.374 |
0.000 0.000 | 0.000 |
0.000 0.000 | 0.000 |
0.193 0.170 | 0.212 |
0.186 0.163 | 0.206 |
0.258 0.248 | 0.267 |
0.000 0.000 | 0.000 |
| 2 spectra, EVAFLHK | 0.000 | 0.380 | 0.000 | 0.000 | 0.109 | 0.325 | 0.186 | 0.000 | ||
| 1 spectrum, GSAFAAEHAK | 0.000 | 0.296 | 0.000 | 0.000 | 0.332 | 0.000 | 0.372 | 0.000 | ||
| 1 spectrum, AQCAIK | 0.057 | 0.158 | 0.000 | 0.000 | 0.000 | 0.544 | 0.241 | 0.000 | ||
| 2 spectra, NLLQVDQNCVR | 0.000 | 0.334 | 0.000 | 0.071 | 0.197 | 0.007 | 0.391 | 0.000 | ||
| 2 spectra, YQHGLGTPDLR | 0.000 | 0.423 | 0.000 | 0.000 | 0.058 | 0.230 | 0.288 | 0.000 | ||
| 1 spectrum, NQNEIIFGLNDGYYGAPFEHK | 0.000 | 0.363 | 0.000 | 0.000 | 0.005 | 0.428 | 0.205 | 0.000 | ||
| 1 spectrum, EEAYQLLIEWK | 0.000 | 0.301 | 0.239 | 0.000 | 0.235 | 0.000 | 0.225 | 0.000 | ||
| 2 spectra, VYLDGLK | 0.000 | 0.286 | 0.000 | 0.000 | 0.296 | 0.151 | 0.266 | 0.000 | ||
| 2 spectra, NSYDVFSLLR | 0.000 | 0.514 | 0.000 | 0.000 | 0.305 | 0.035 | 0.146 | 0.000 | ||
| 1 spectrum, LQFDYGVYLLNK | 0.000 | 0.270 | 0.000 | 0.000 | 0.271 | 0.161 | 0.298 | 0.000 | ||
| 3 spectra, QTQVTVQR | 0.000 | 0.466 | 0.000 | 0.000 | 0.340 | 0.047 | 0.147 | 0.000 |
| Plot | Mito | Lyso or Perox | ER | Golgi | PM | Cytosol | Nucleus | ||||||
| Expt B |
2 peptides |
2 spectra |
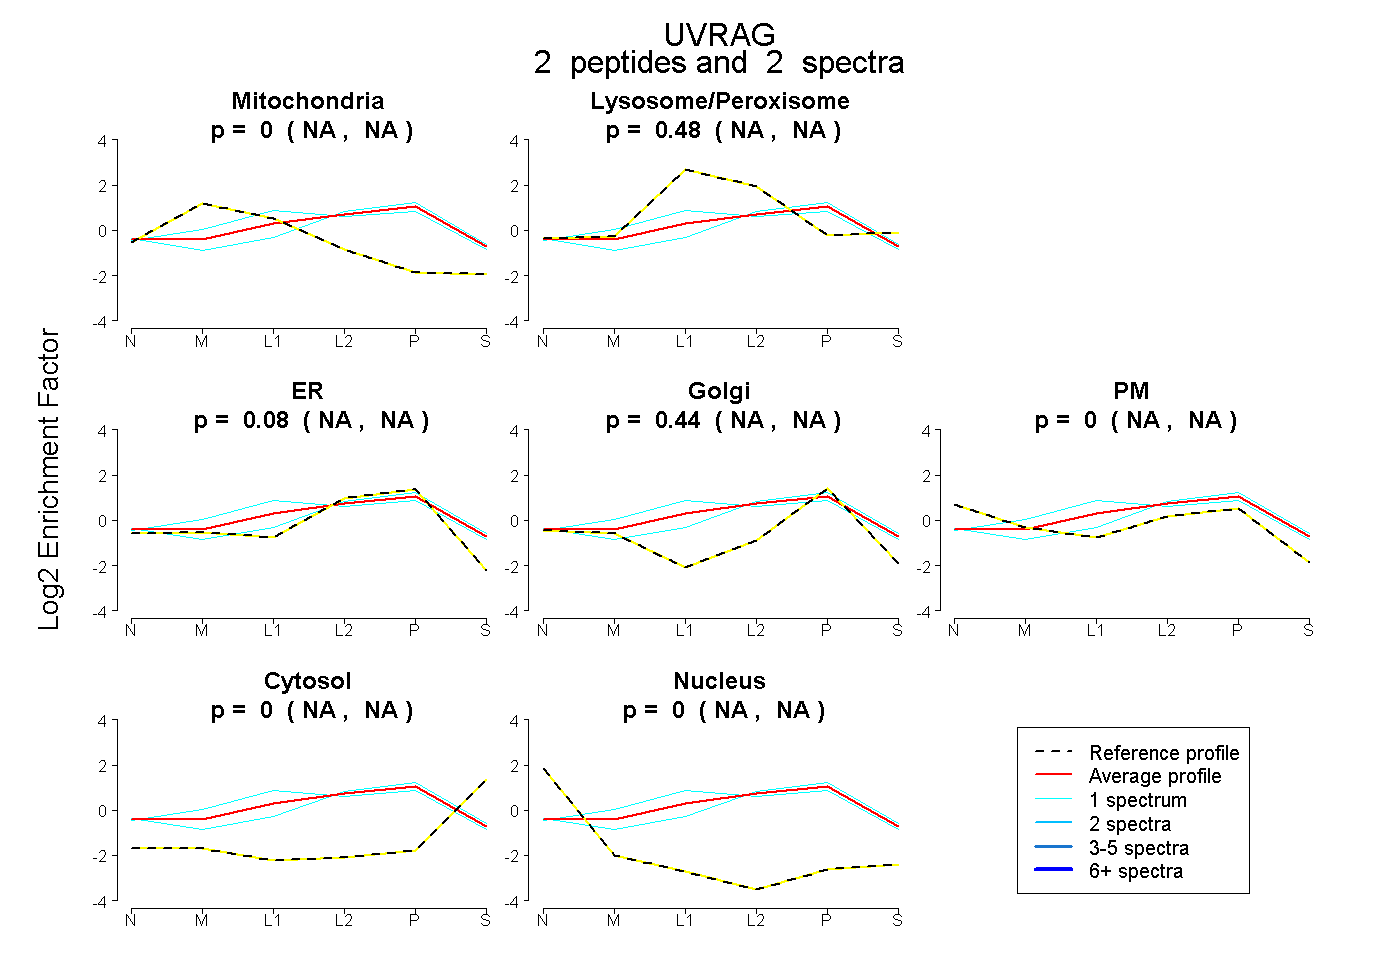 |
0.000 NA | NA |
0.483 NA | NA |
0.080 NA | NA |
0.436 NA | NA |
0.000 NA | NA |
0.000 NA | NA |
0.000 NA | NA |
|||
| Plot | Lyso | Other | |||||||||||
| Expt C |
17 peptides |
41 spectra |
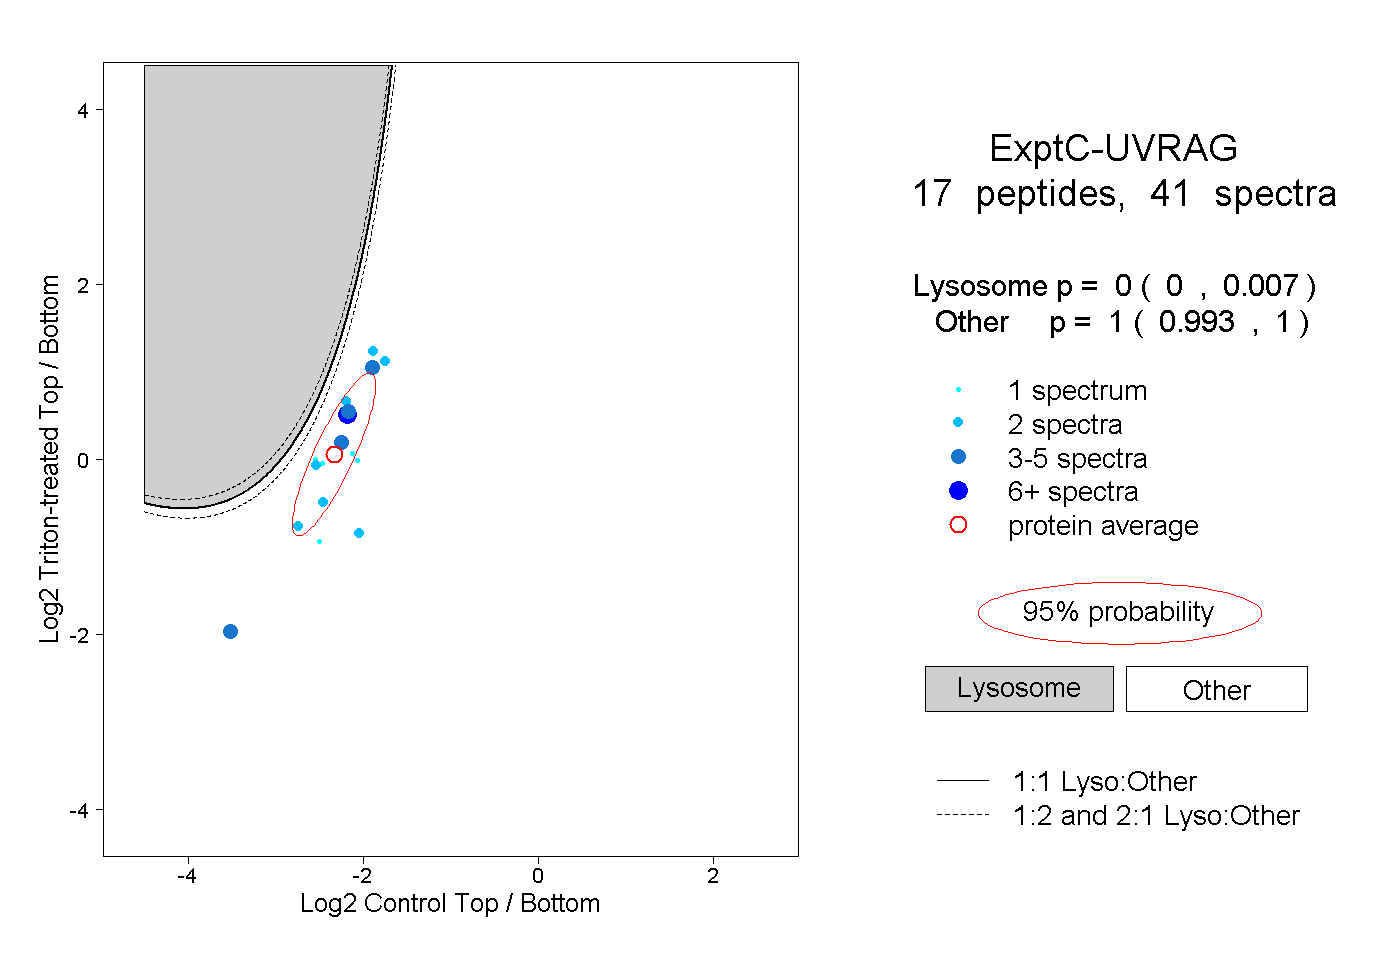 |
0.000 0.000 | 0.007 |
1.000 0.993 | 1.000 |
||||||||
| Plot | Lyso | Other | |||||||||||
| Expt D |
3 peptides |
6 spectra |
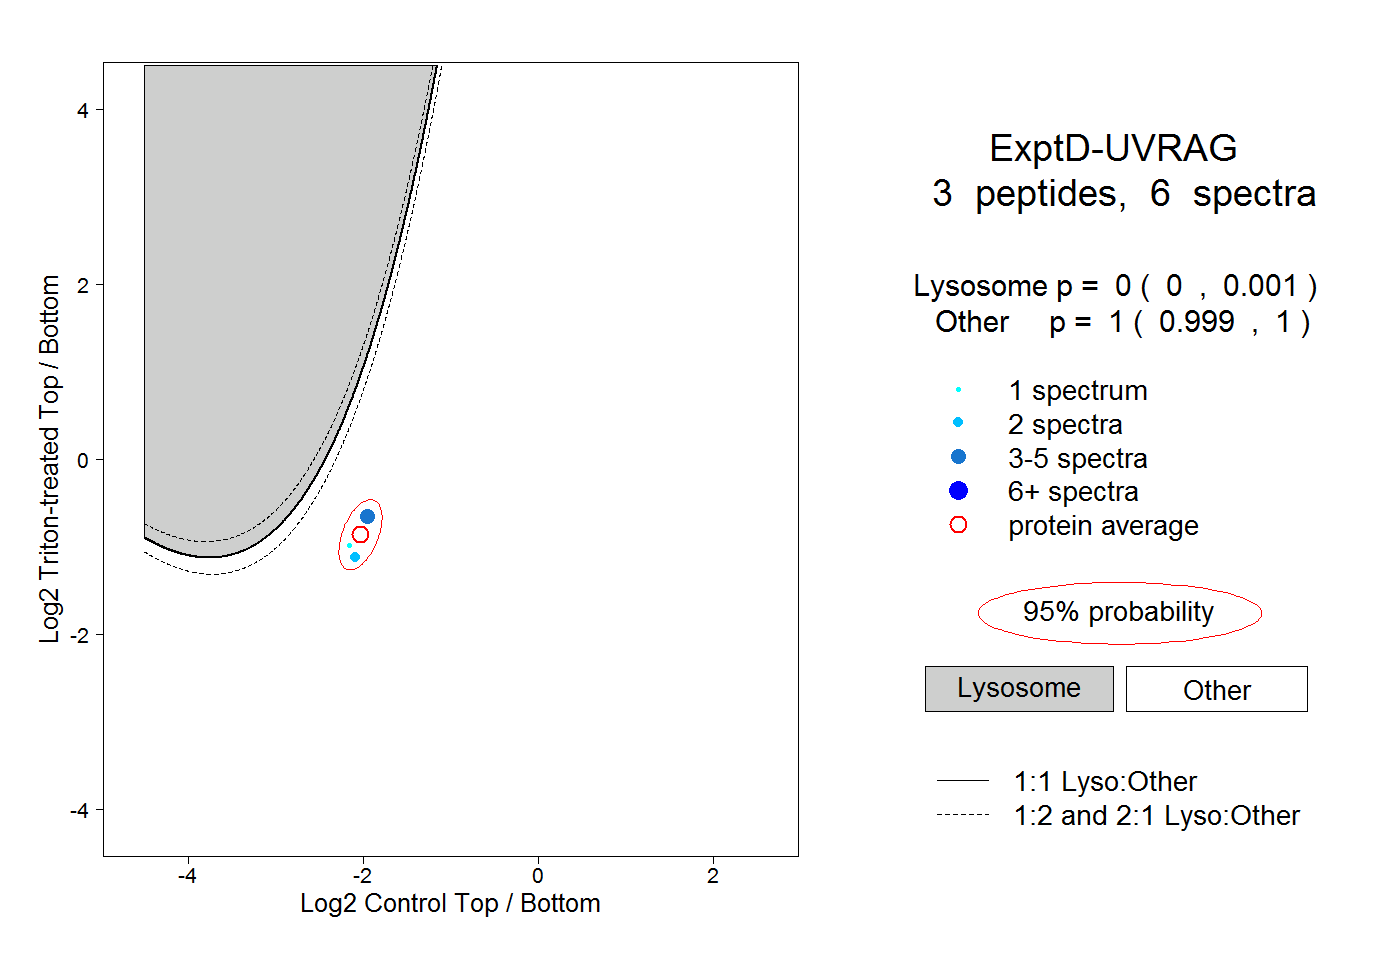 |
0.000 0.000 | 0.001 |
1.000 0.999 | 1.000 |