 3
3peptides
spectra
0.000 | 0.000
0.182 | 0.287
0.000 | 0.000
0.000 | 0.000
0.534 | 0.705
0.000 | 0.092
0.055 | 0.132
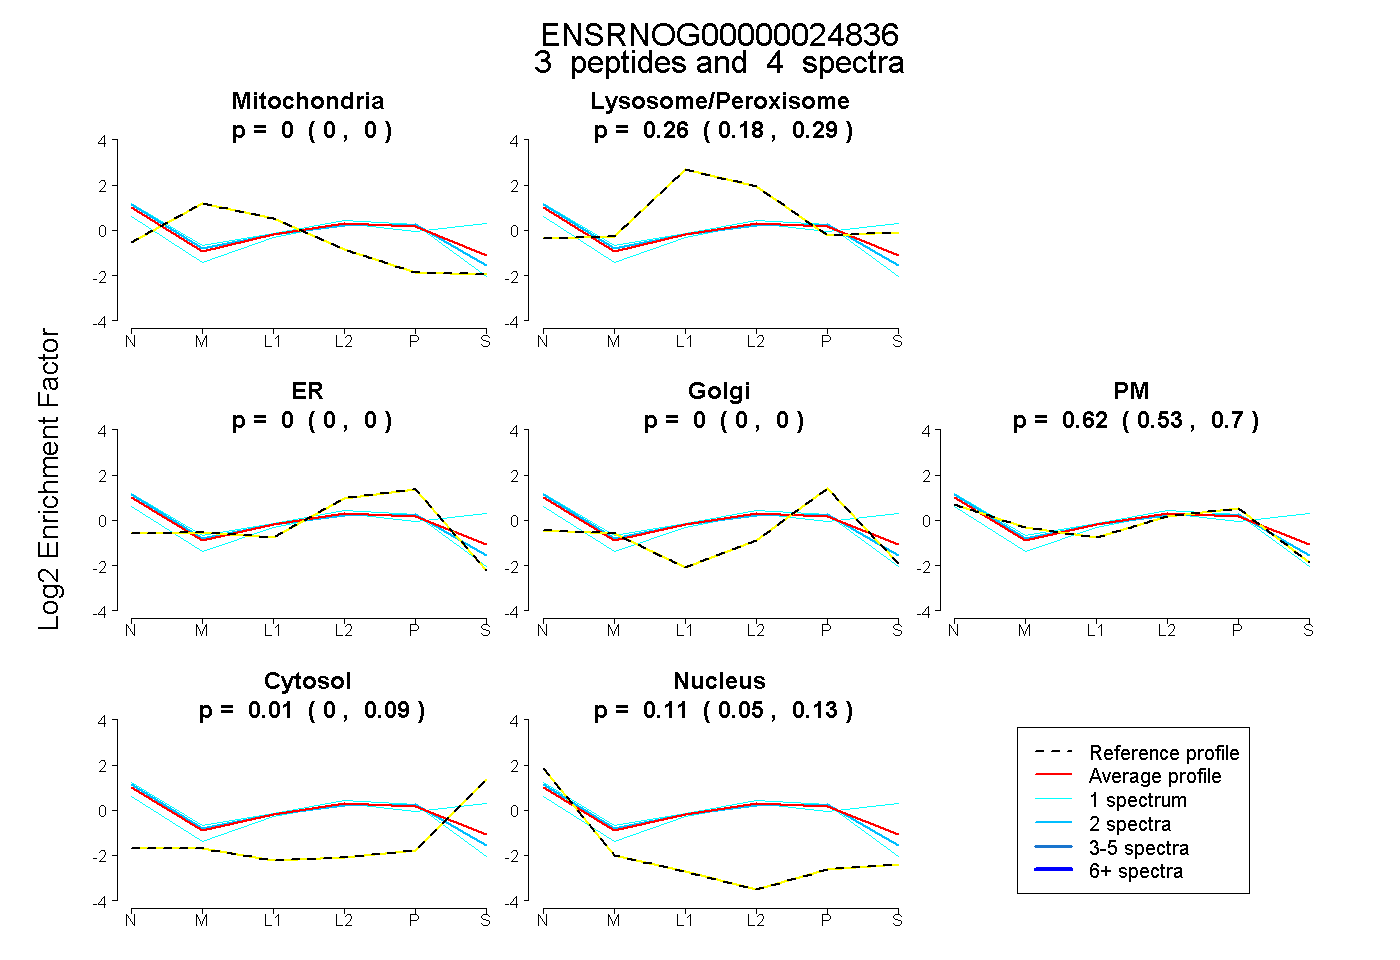
| Plot | Mito | Lyso or Perox | ER | Golgi | PM | Cytosol | Nucleus | ||||||
| Expt B |
3 peptides |
4 spectra |
|
0.000 0.000 | 0.000 |
0.257 0.182 | 0.287 |
0.000 0.000 | 0.000 |
0.000 0.000 | 0.000 |
0.621 0.534 | 0.705 |
0.008 0.000 | 0.092 |
0.115 0.055 | 0.132 |
| 1 spectrum, GEATVSFDDPPSAK | 0.000 | 0.139 | 0.000 | 0.000 | 0.808 | 0.000 | 0.053 | |||
| 2 spectra, VSFATR | 0.000 | 0.191 | 0.000 | 0.000 | 0.712 | 0.000 | 0.097 | |||
| 1 spectrum, AAIDWFDGK | 0.000 | 0.311 | 0.000 | 0.000 | 0.393 | 0.279 | 0.017 |
| Plot | Lyso | Other | |||||||||||
| Expt C |
5 peptides |
8 spectra |
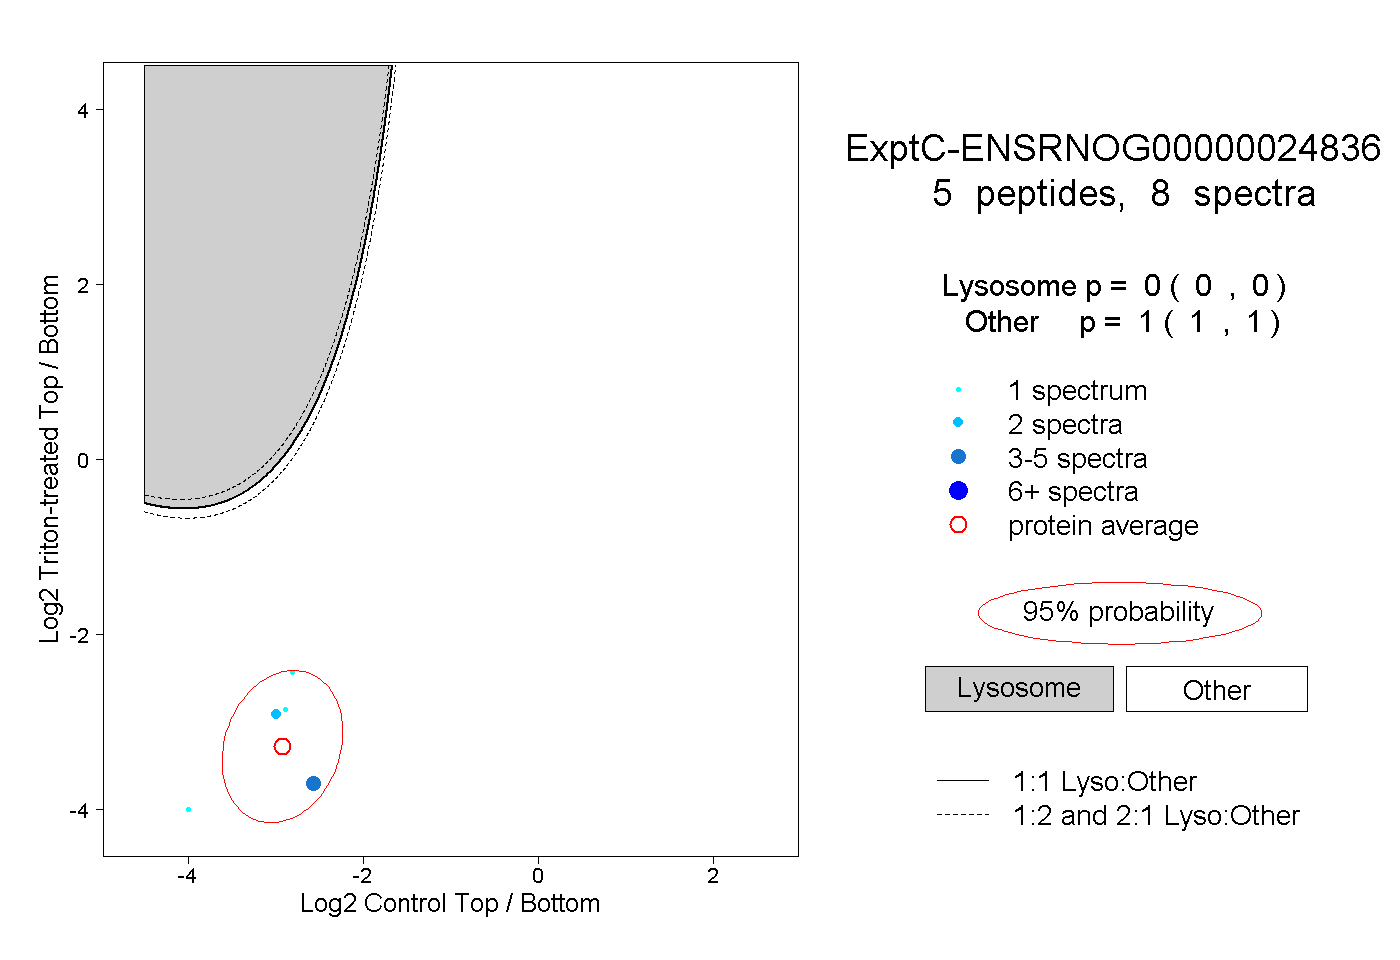 |
0.000 0.000 | 0.000 |
1.000 1.000 | 1.000 |