 3
3peptides
spectra
0.000 | 0.040
0.000 | 0.000
0.000 | 0.133
0.000 | 0.397
0.000 | 0.421
0.000 | 0.126
0.180 | 0.343
0.211 | 0.378
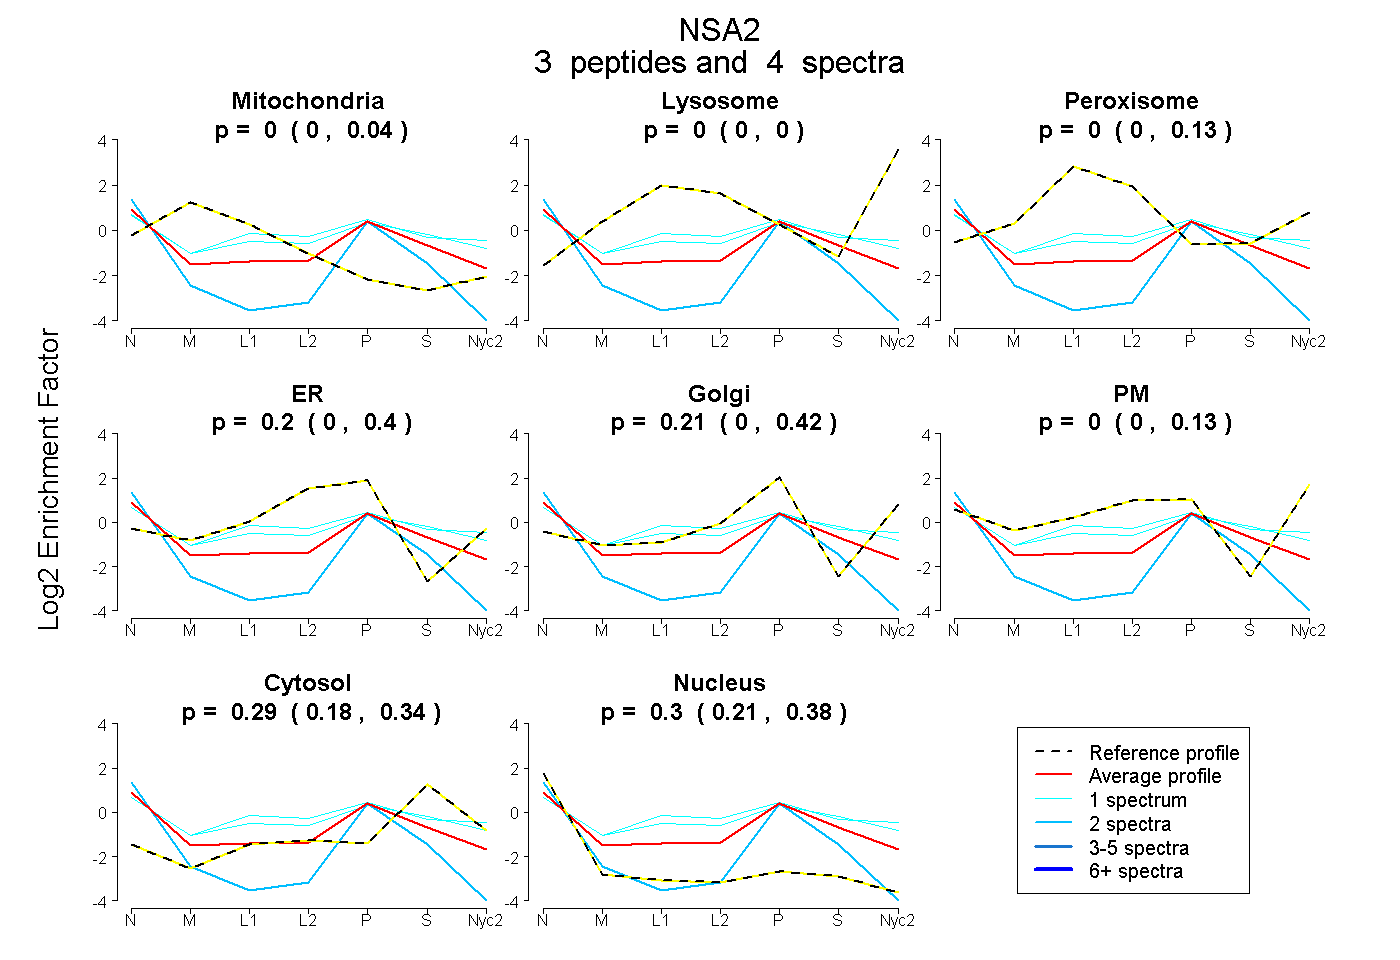
| Plot | Mito | Lyso | Perox | ER | Golgi | PM | Cytosol | Nucleus | |||||
| Expt A |
3 peptides |
4 spectra |
|
0.000 0.000 | 0.040 |
0.000 0.000 | 0.000 |
0.000 0.000 | 0.133 |
0.197 0.000 | 0.397 |
0.214 0.000 | 0.421 |
0.000 0.000 | 0.126 |
0.292 0.180 | 0.343 |
0.297 0.211 | 0.378 |