 6
6peptides
spectra
0.000 | 0.000
0.554 | 0.579
0.000 | 0.000
0.000 | 0.000
0.036 | 0.071
0.253 | 0.302
0.088 | 0.103
0.000 | 0.000
| Plot | Mito | Lyso | Perox | ER | Golgi | PM | Cytosol | Nucleus | |||||
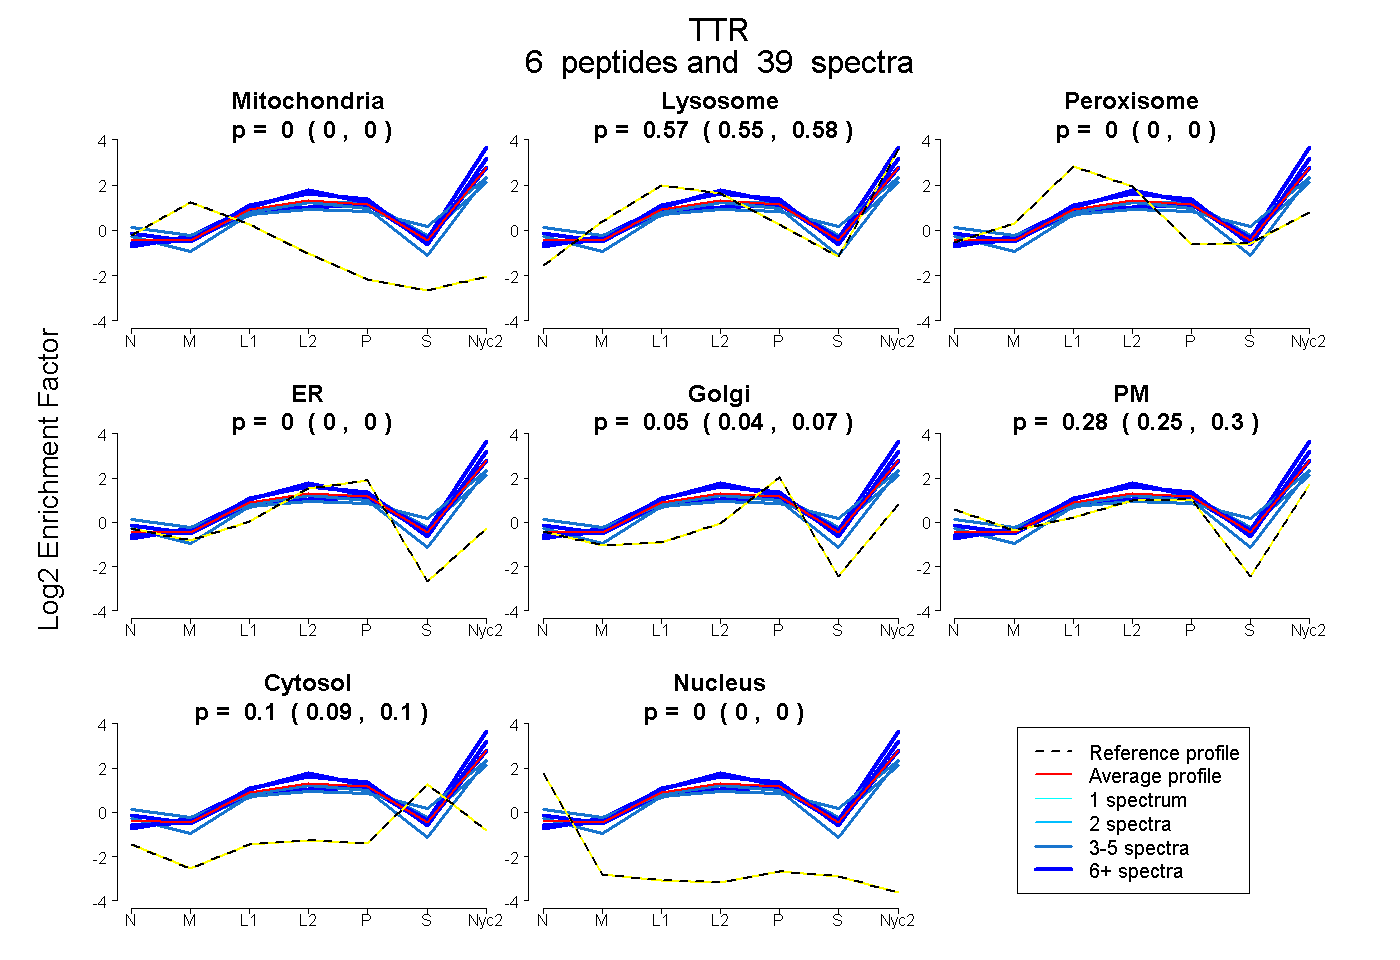
| Expt A |
6 peptides |
39 spectra |
|
0.000 0.000 | 0.000 |
0.568 0.554 | 0.579 |
0.000 0.000 | 0.000 |
0.000 0.000 | 0.000 |
0.055 0.036 | 0.071 |
0.281 0.253 | 0.302 |
0.096 0.088 | 0.103 |
0.000 0.000 | 0.000 |
| 7 spectra, GSPAVDVAVK | 0.000 | 0.502 | 0.000 | 0.000 | 0.021 | 0.368 | 0.109 | 0.000 | ||
| 3 spectra, CPLMVK | 0.000 | 0.537 | 0.015 | 0.083 | 0.148 | 0.071 | 0.146 | 0.000 | ||
| 12 spectra, VIDAVR | 0.000 | 0.682 | 0.000 | 0.000 | 0.148 | 0.155 | 0.015 | 0.000 | ||
| 4 spectra, TAESGELHGLTTDEK | 0.000 | 0.484 | 0.000 | 0.000 | 0.000 | 0.265 | 0.251 | 0.000 | ||
| 4 spectra, TADGSWEPFASGK | 0.000 | 0.346 | 0.030 | 0.000 | 0.000 | 0.572 | 0.053 | 0.000 | ||
| 9 spectra, FTEGVYR | 0.000 | 0.793 | 0.000 | 0.000 | 0.109 | 0.083 | 0.014 | 0.000 |
| Plot | Mito | Lyso or Perox | ER | Golgi | PM | Cytosol | Nucleus | ||||||
| Expt B |
6 peptides |
25 spectra |
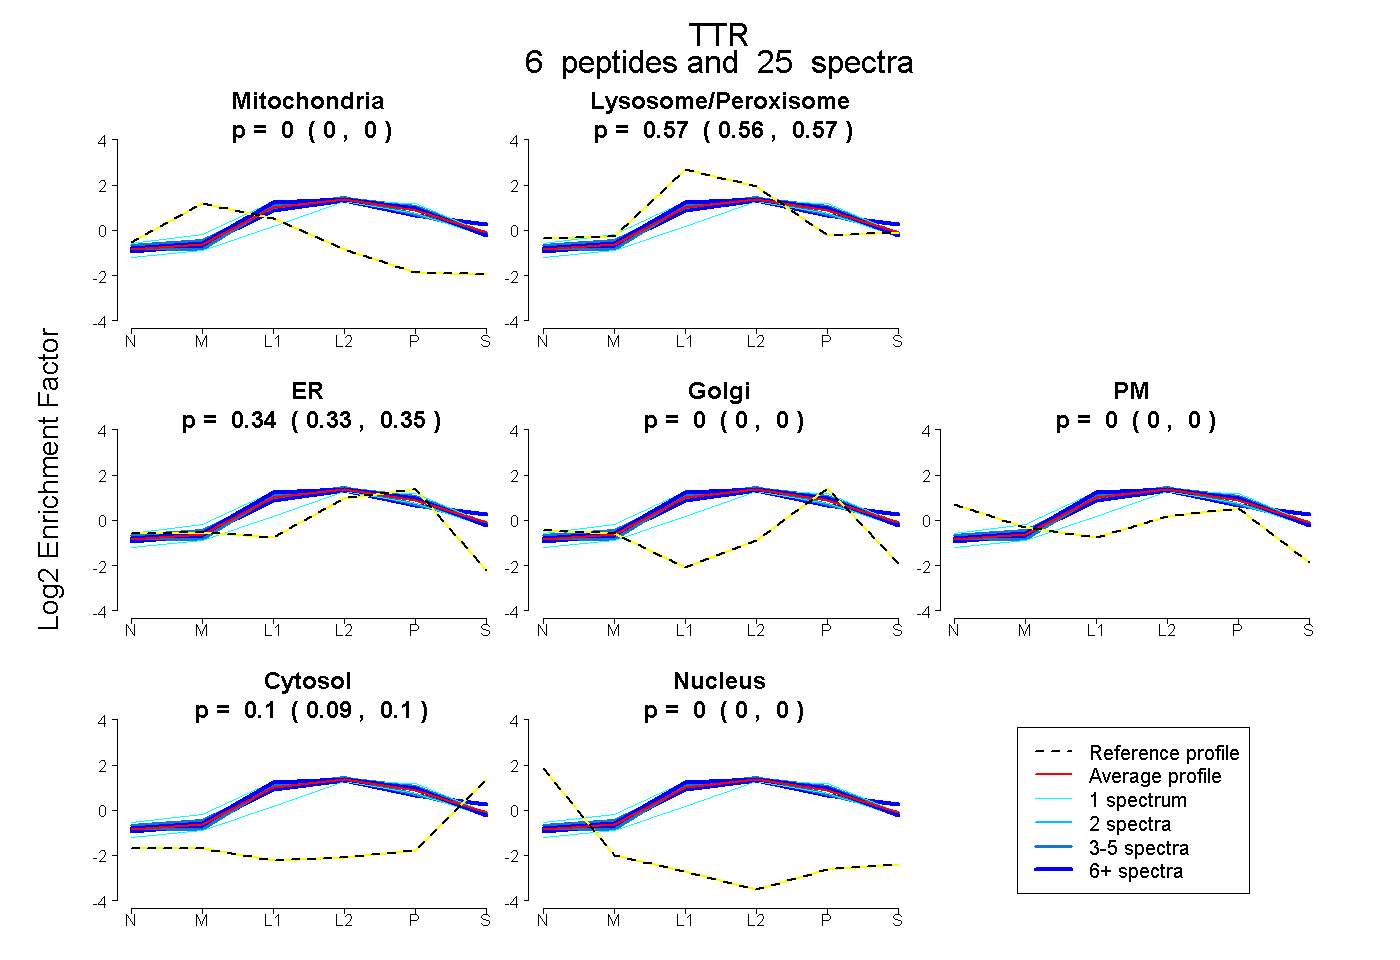 |
0.000 0.000 | 0.000 |
0.566 0.556 | 0.574 |
0.338 0.327 | 0.346 |
0.000 0.000 | 0.001 |
0.000 0.000 | 0.000 |
0.097 0.091 | 0.101 |
0.000 0.000 | 0.000 |
|||
| Plot | Lyso | Other | |||||||||||
| Expt C |
7 peptides |
252 spectra |
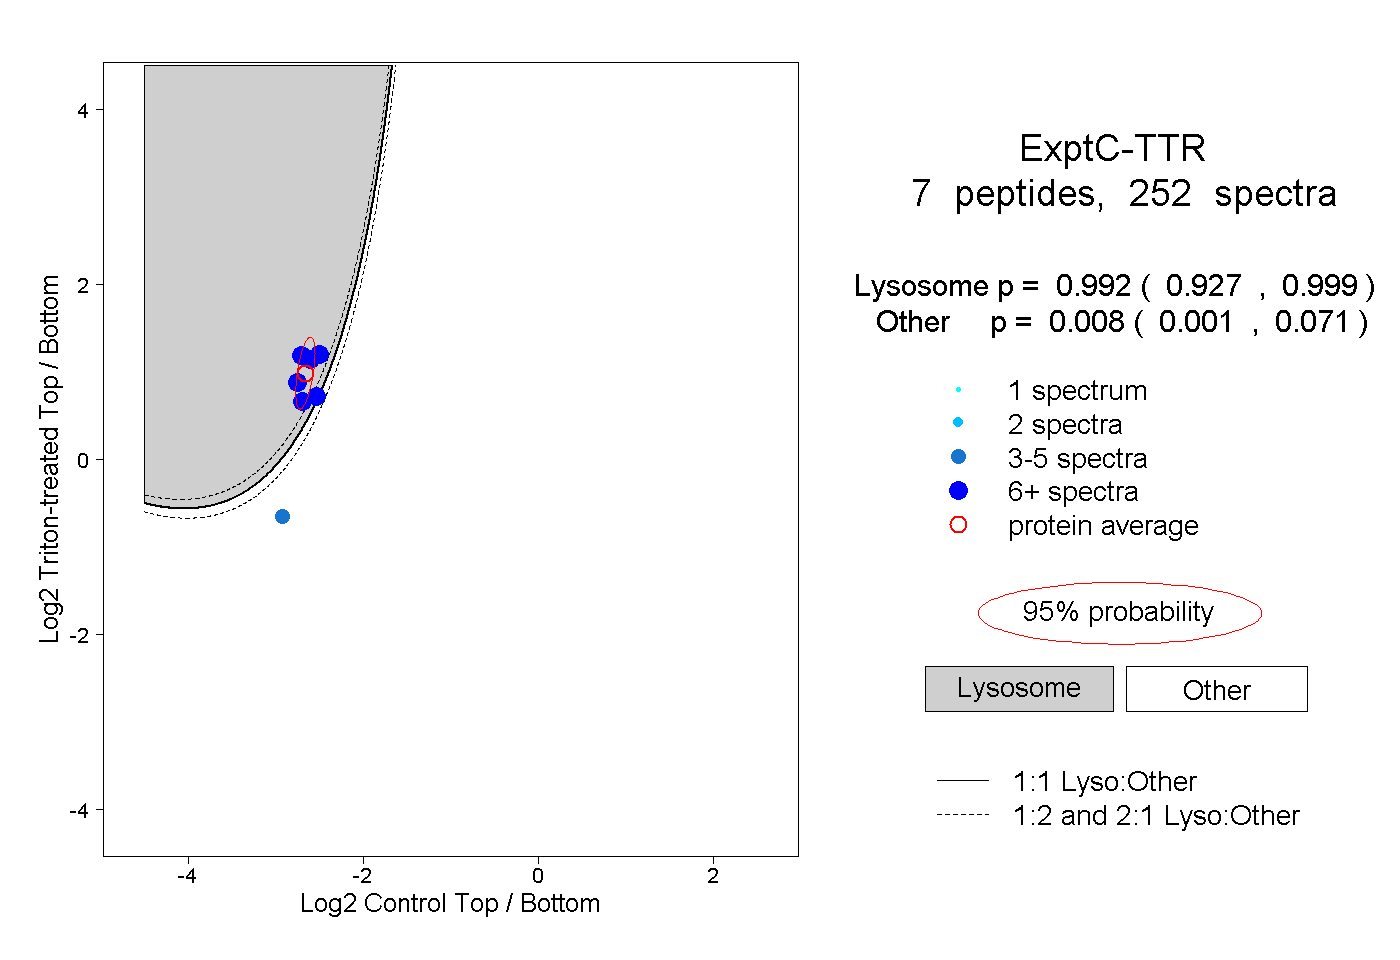 |
0.992 0.927 | 0.999 |
0.008 0.001 | 0.071 |
||||||||
| Plot | Lyso | Other | |||||||||||
| Expt D |
5 peptides |
16 spectra |
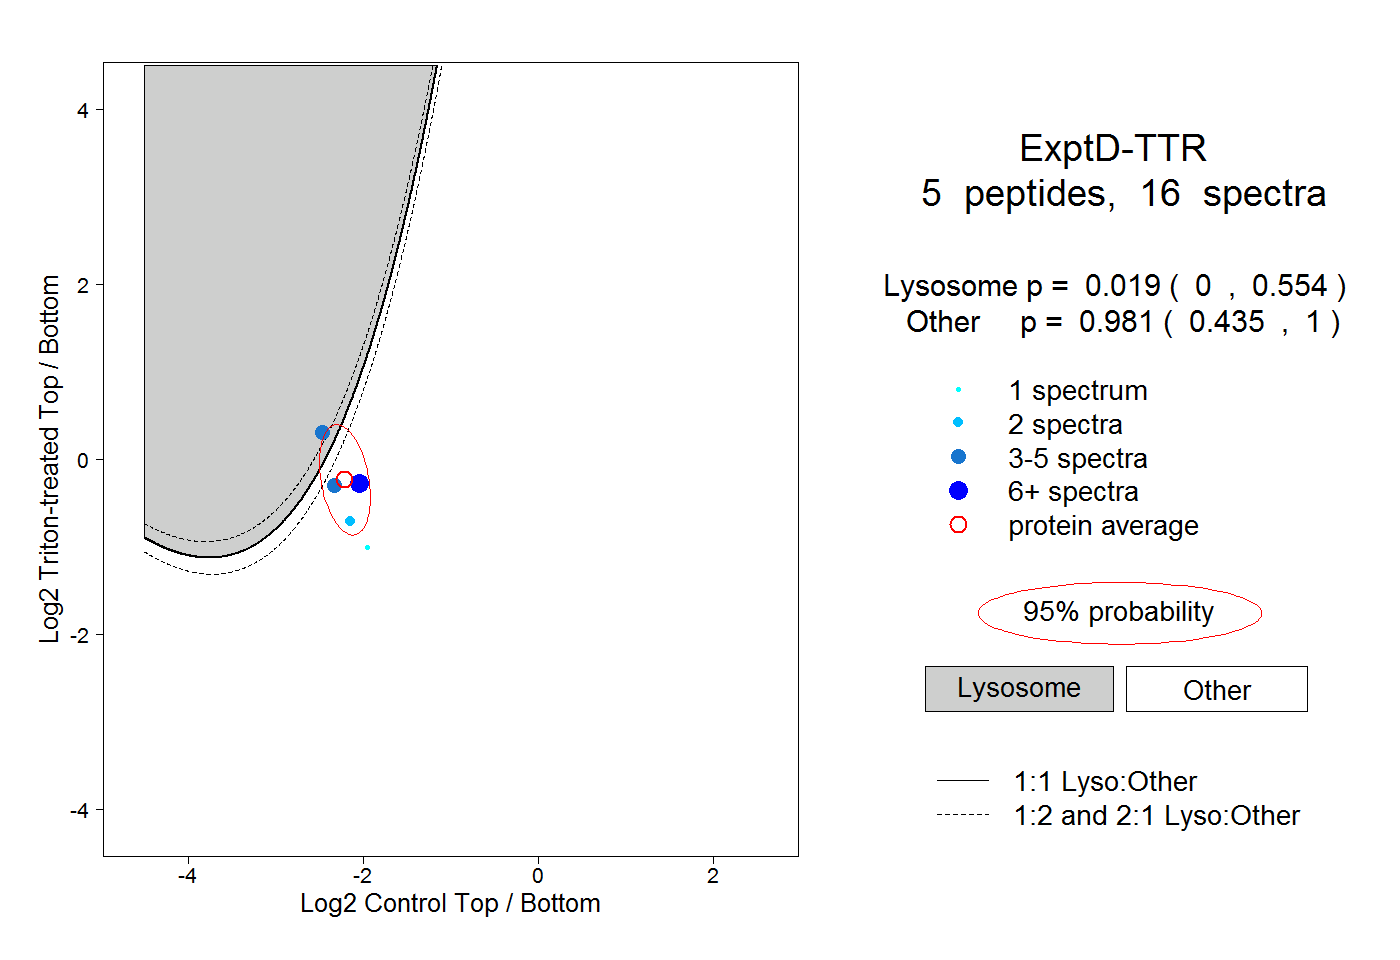 |
0.019 0.000 | 0.554 |
0.981 0.435 | 1.000 |