 8
8peptides
spectra
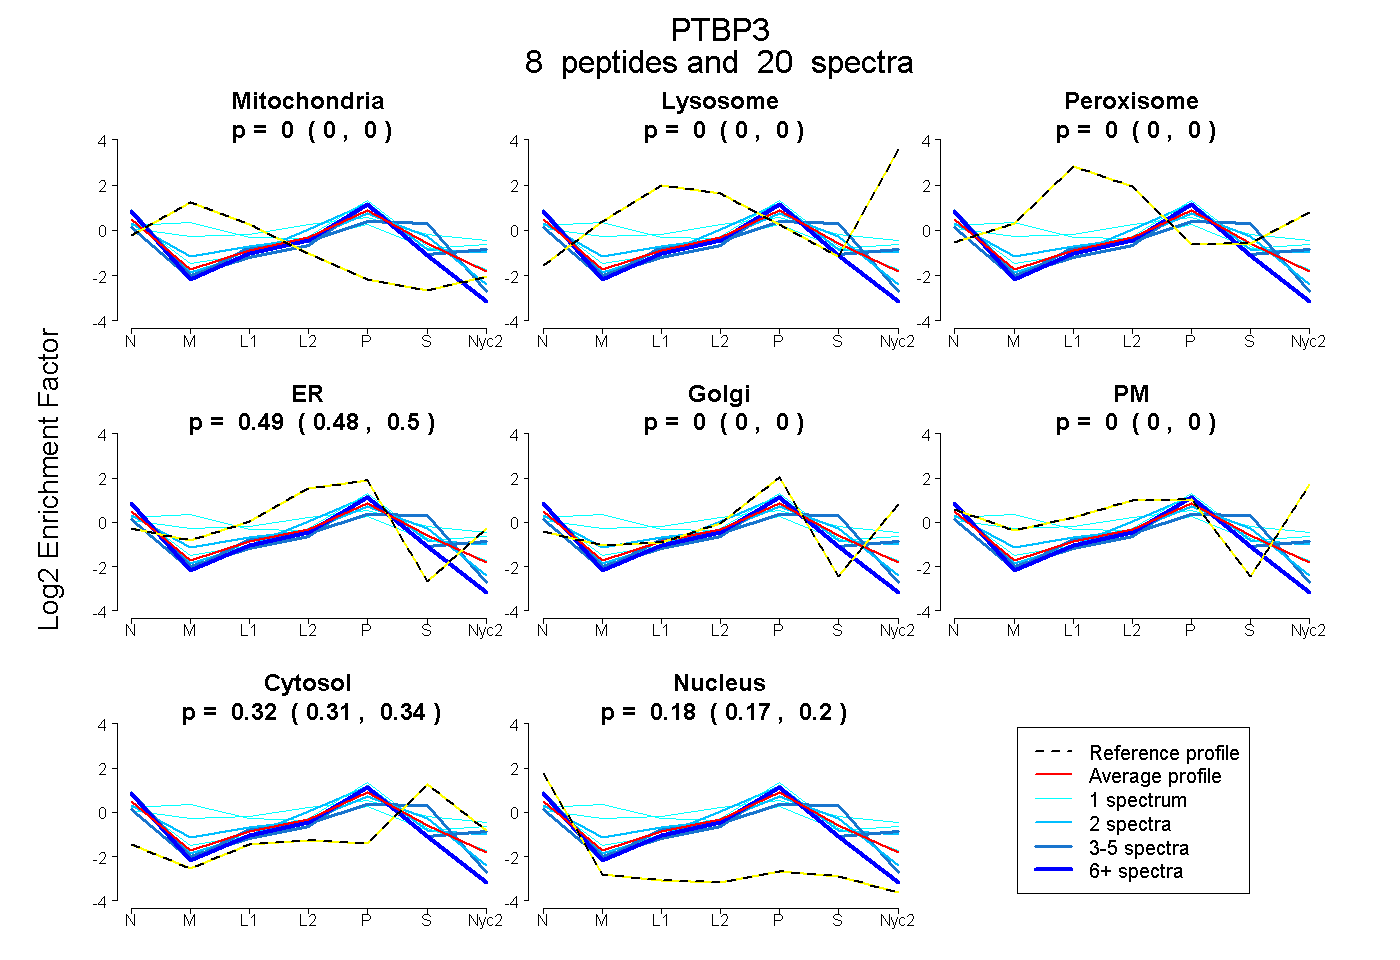
0.000 | 0.000
0.000 | 0.000
0.000 | 0.000
0.480 | 0.501
0.000 | 0.000
0.000 | 0.000
0.306 | 0.339
0.169 | 0.198
3peptides
spectra
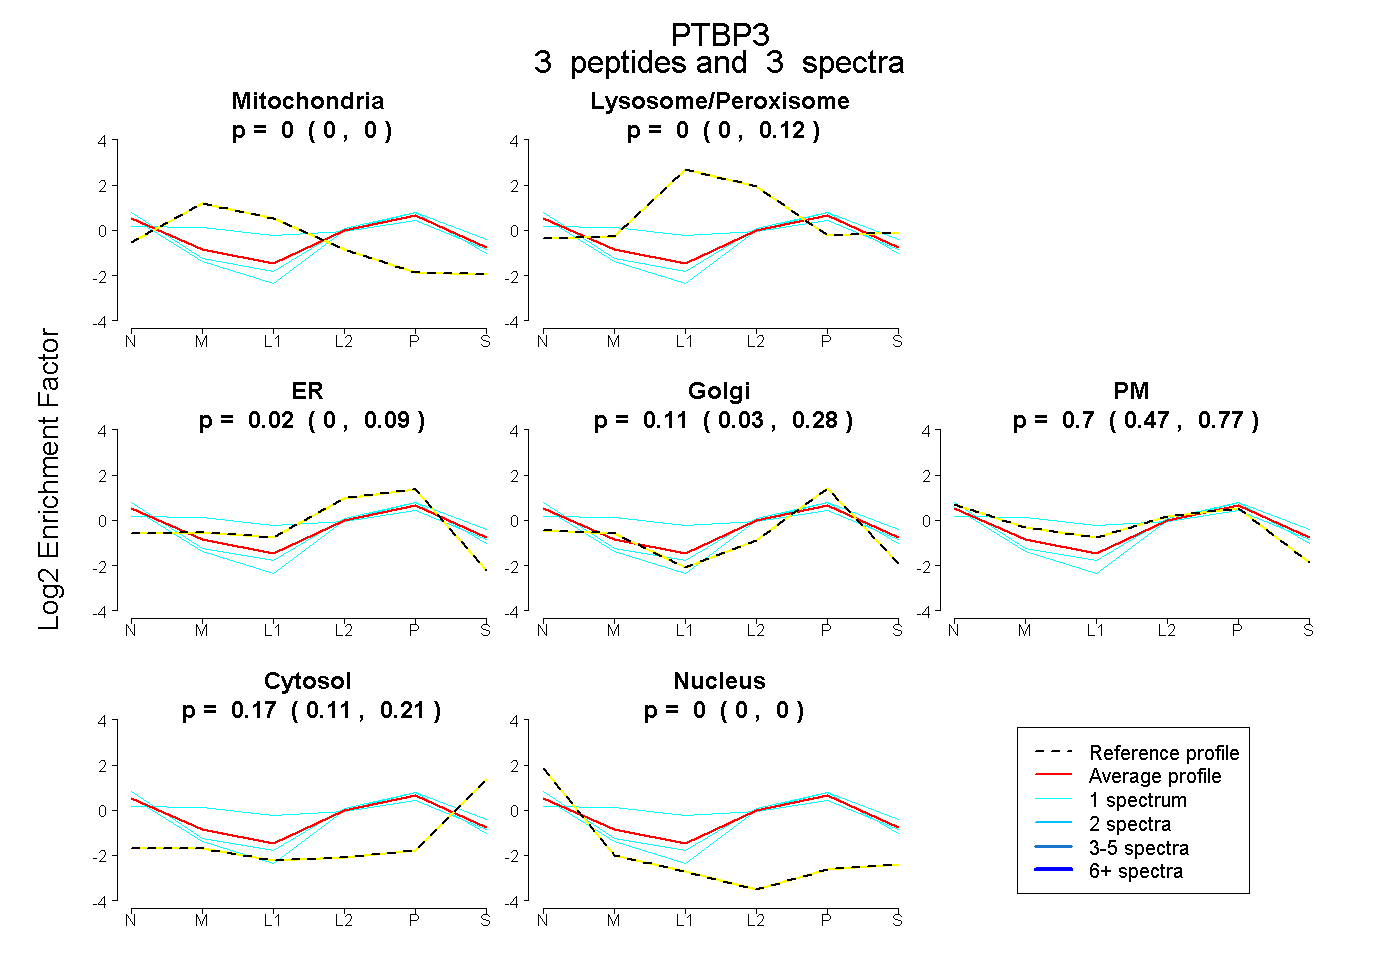
0.000 | 0.000
0.000 | 0.123
0.000 | 0.086
0.025 | 0.281
0.472 | 0.769
0.113 | 0.206
0.000 | 0.000
3peptides
spectra
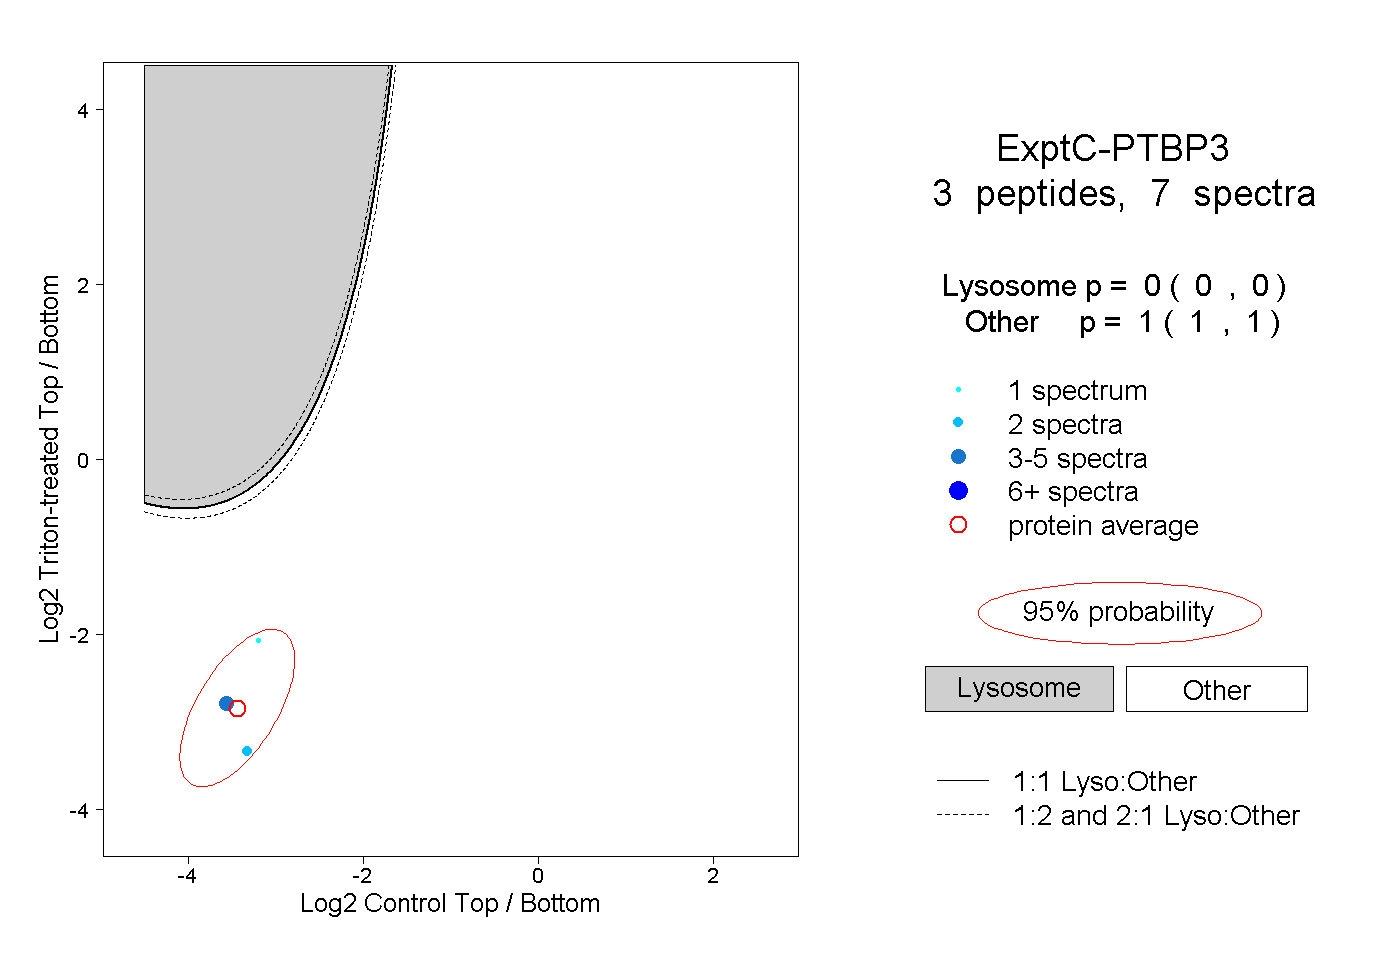
0.000 | 0.000
1.000 | 1.000
2peptides
spectra
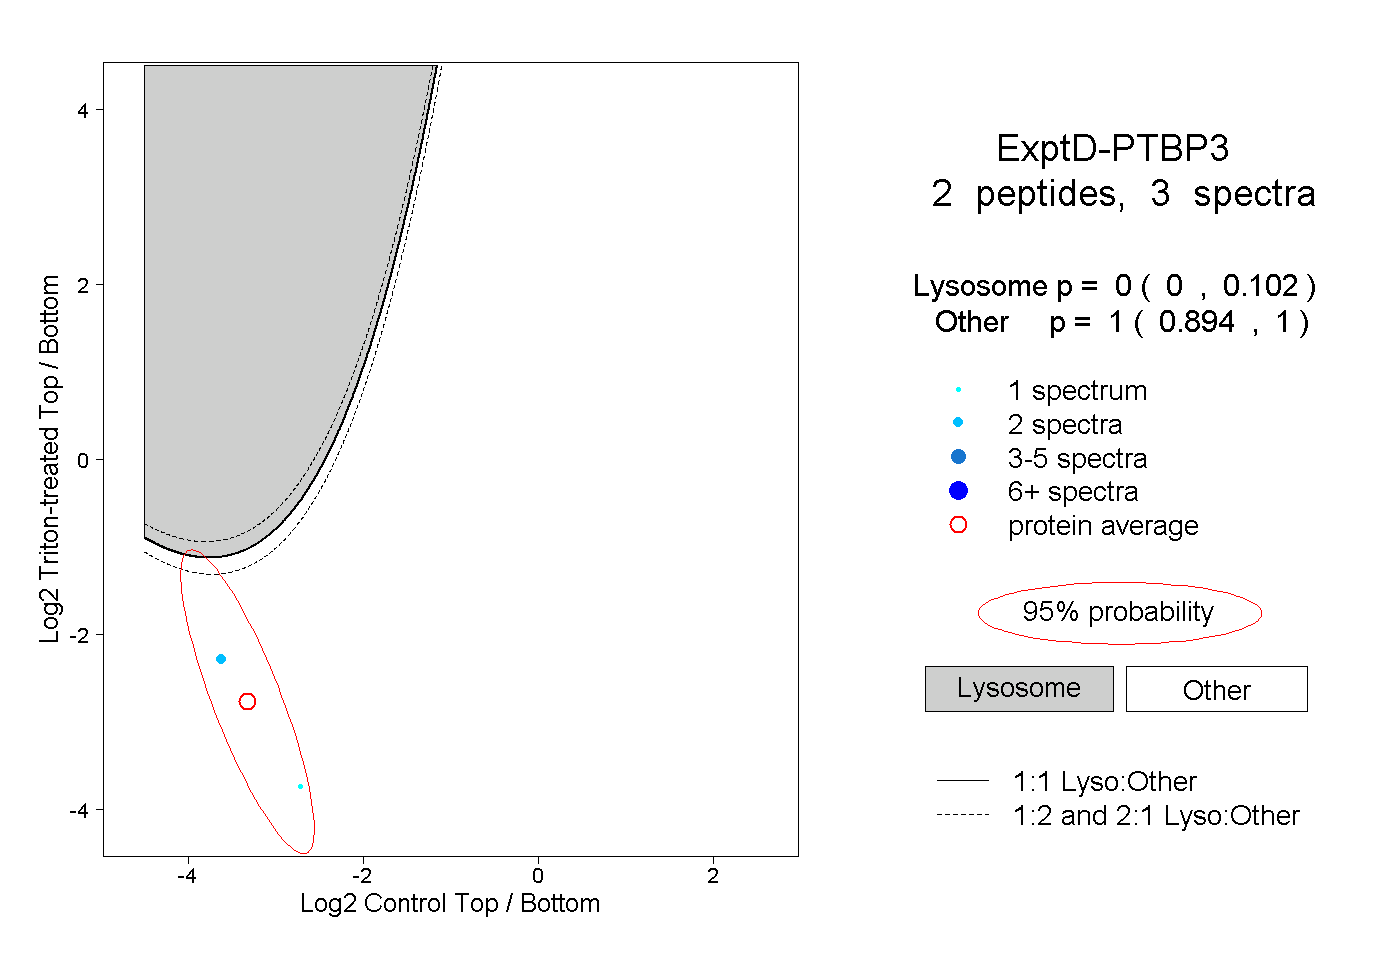
0.000 | 0.102
0.894 | 1.000