 11
11peptides
spectra

0.763 | 0.773
0.022 | 0.037
0.000 | 0.000
0.000 | 0.000
0.000 | 0.000
0.192 | 0.209
0.000 | 0.000
0.000 | 0.000
| Plot | Mito | Lyso | Perox | ER | Golgi | PM | Cytosol | Nucleus | |||||
| Expt A |
11 peptides |
42 spectra |
|
0.768 0.763 | 0.773 |
0.031 0.022 | 0.037 |
0.000 0.000 | 0.000 |
0.000 0.000 | 0.000 |
0.000 0.000 | 0.000 |
0.201 0.192 | 0.209 |
0.000 0.000 | 0.000 |
0.000 0.000 | 0.000 |
| 2 spectra, LQSWLYASR | 0.798 | 0.044 | 0.000 | 0.000 | 0.000 | 0.158 | 0.000 | 0.000 | ||
| 2 spectra, LHEYSR | 0.754 | 0.067 | 0.078 | 0.000 | 0.000 | 0.101 | 0.000 | 0.000 | ||
| 4 spectra, IYDSFR | 0.763 | 0.057 | 0.000 | 0.000 | 0.011 | 0.168 | 0.000 | 0.000 | ||
| 2 spectra, FYDNPK | 0.795 | 0.000 | 0.000 | 0.000 | 0.000 | 0.205 | 0.000 | 0.000 | ||
| 1 spectrum, QCVDHYNEIK | 0.721 | 0.062 | 0.000 | 0.000 | 0.000 | 0.217 | 0.000 | 0.000 | ||
| 5 spectra, SNDGNSYR | 0.842 | 0.000 | 0.000 | 0.000 | 0.000 | 0.158 | 0.000 | 0.000 | ||
| 2 spectra, GDPHEMK | 0.645 | 0.016 | 0.000 | 0.000 | 0.000 | 0.339 | 0.000 | 0.000 | ||
| 3 spectra, VITVDGNICSGK | 0.910 | 0.000 | 0.000 | 0.073 | 0.000 | 0.017 | 0.000 | 0.000 | ||
| 9 spectra, TFHNLR | 0.652 | 0.000 | 0.082 | 0.102 | 0.000 | 0.164 | 0.000 | 0.000 | ||
| 5 spectra, DIAEQLGMK | 0.807 | 0.087 | 0.000 | 0.000 | 0.000 | 0.106 | 0.000 | 0.000 | ||
| 7 spectra, VVEDIEYLNYNK | 0.684 | 0.000 | 0.080 | 0.026 | 0.000 | 0.209 | 0.000 | 0.000 |
| Plot | Mito | Lyso or Perox | ER | Golgi | PM | Cytosol | Nucleus | ||||||
| Expt B |
9 peptides |
32 spectra |
 |
0.899 0.885 | 0.910 |
0.000 0.000 | 0.000 |
0.101 0.088 | 0.112 |
0.000 0.000 | 0.000 |
0.000 0.000 | 0.000 |
0.000 0.000 | 0.000 |
0.000 0.000 | 0.000 |
|||
| Plot | Lyso | Other | |||||||||||
| Expt C |
14 peptides |
172 spectra |
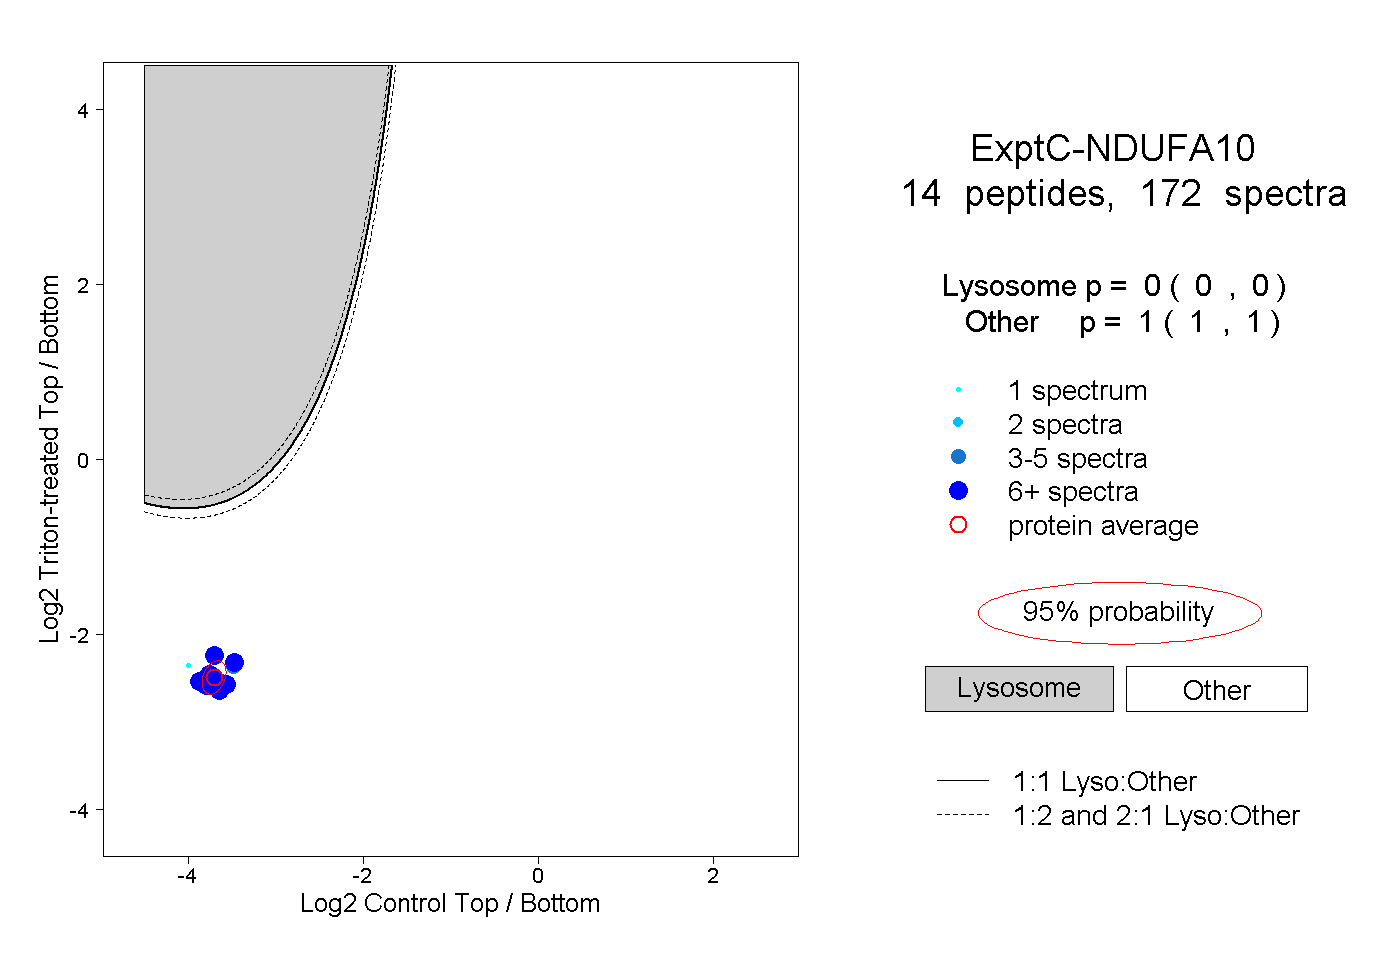 |
0.000 0.000 | 0.000 |
1.000 1.000 | 1.000 |
||||||||
| Plot | Lyso | Other | |||||||||||
| Expt D |
6 peptides |
19 spectra |
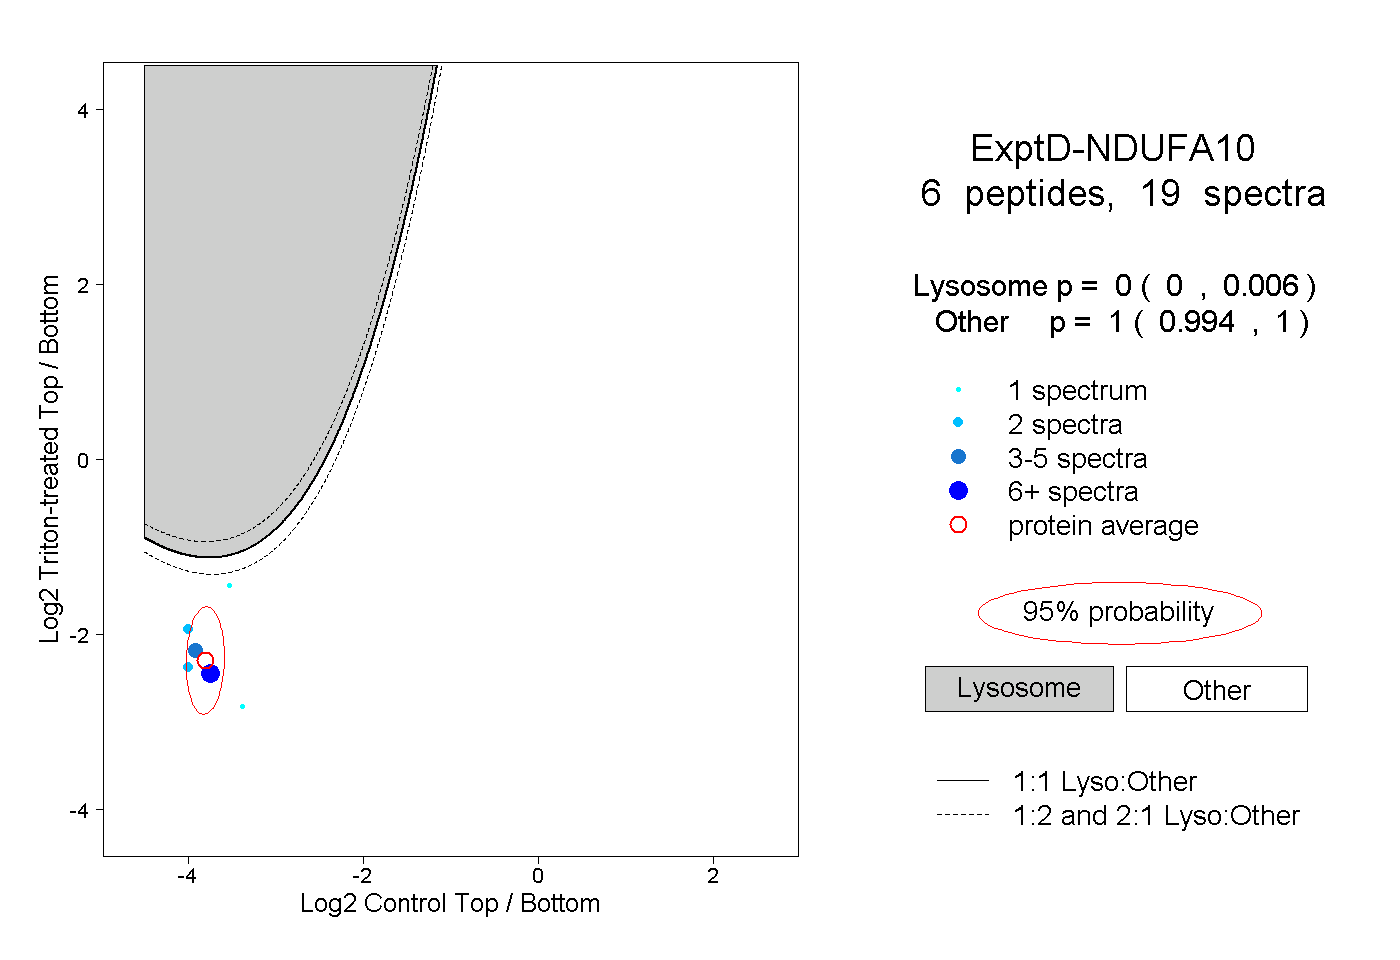 |
0.000 0.000 | 0.006 |
1.000 0.994 | 1.000 |