11
11peptides
spectra
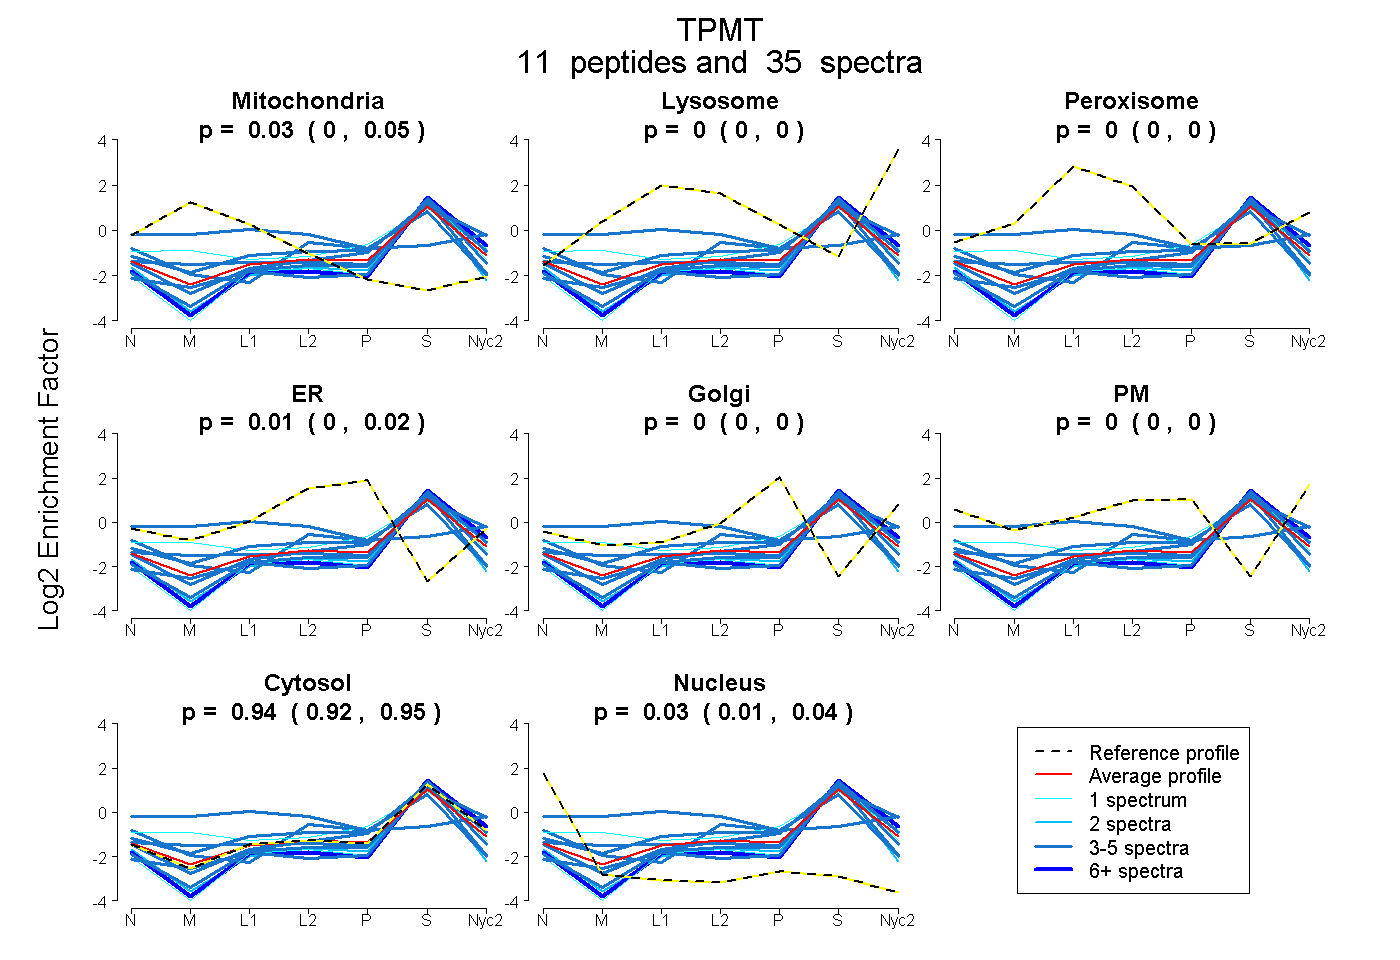
0.002 | 0.046
0.000 | 0.000
0.000 | 0.000
0.000 | 0.017
0.000 | 0.000
0.000 | 0.000
0.923 | 0.951
0.011 | 0.040
7peptides
spectra
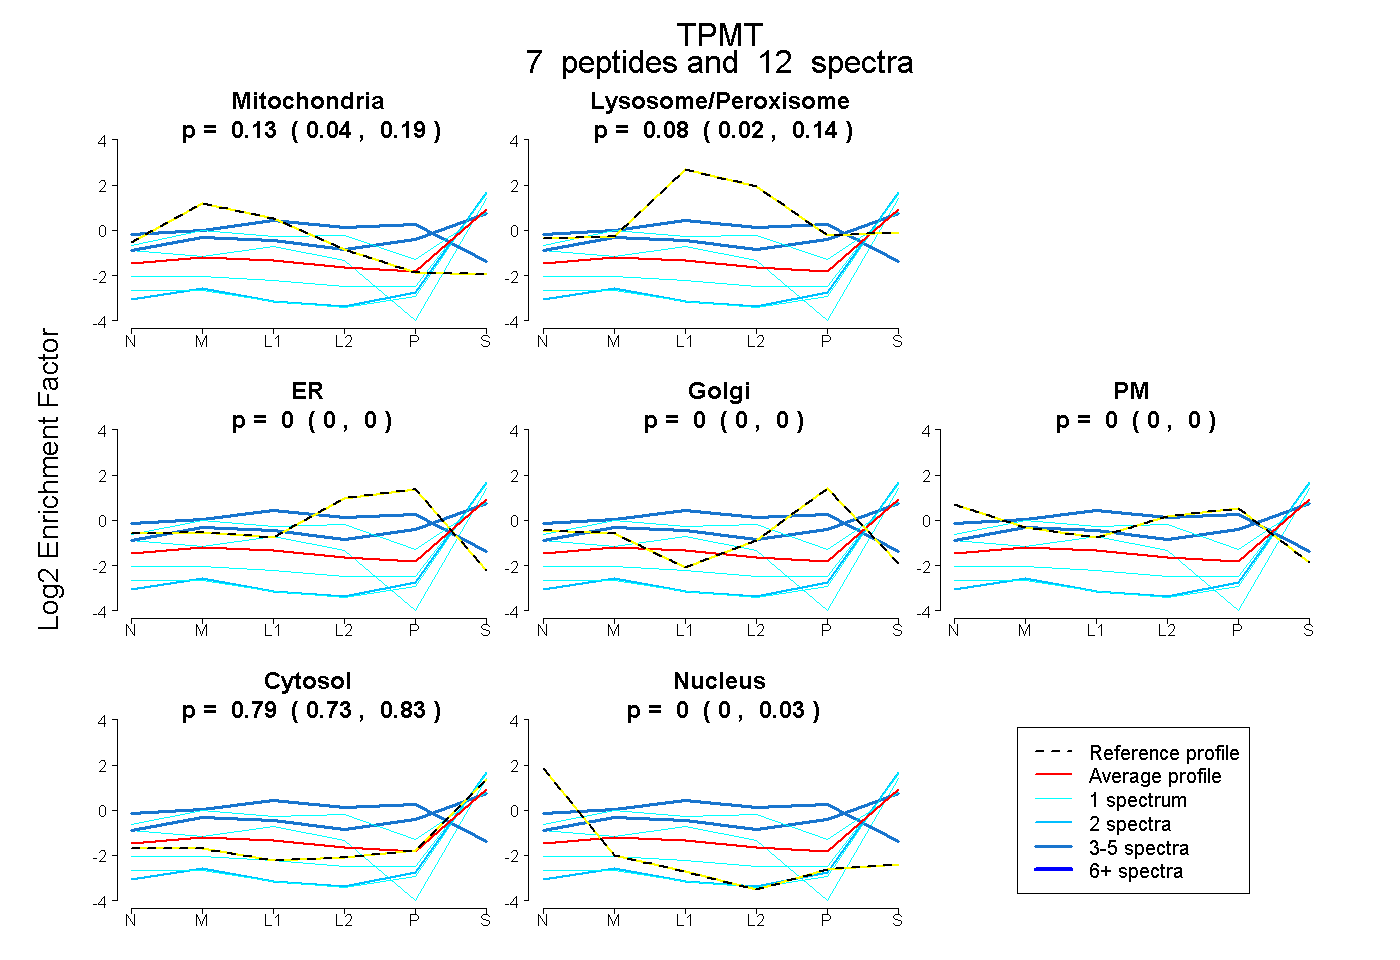
0.043 | 0.189
0.021 | 0.144
0.000 | 0.000
0.000 | 0.001
0.000 | 0.000
0.735 | 0.828
0.000 | 0.034
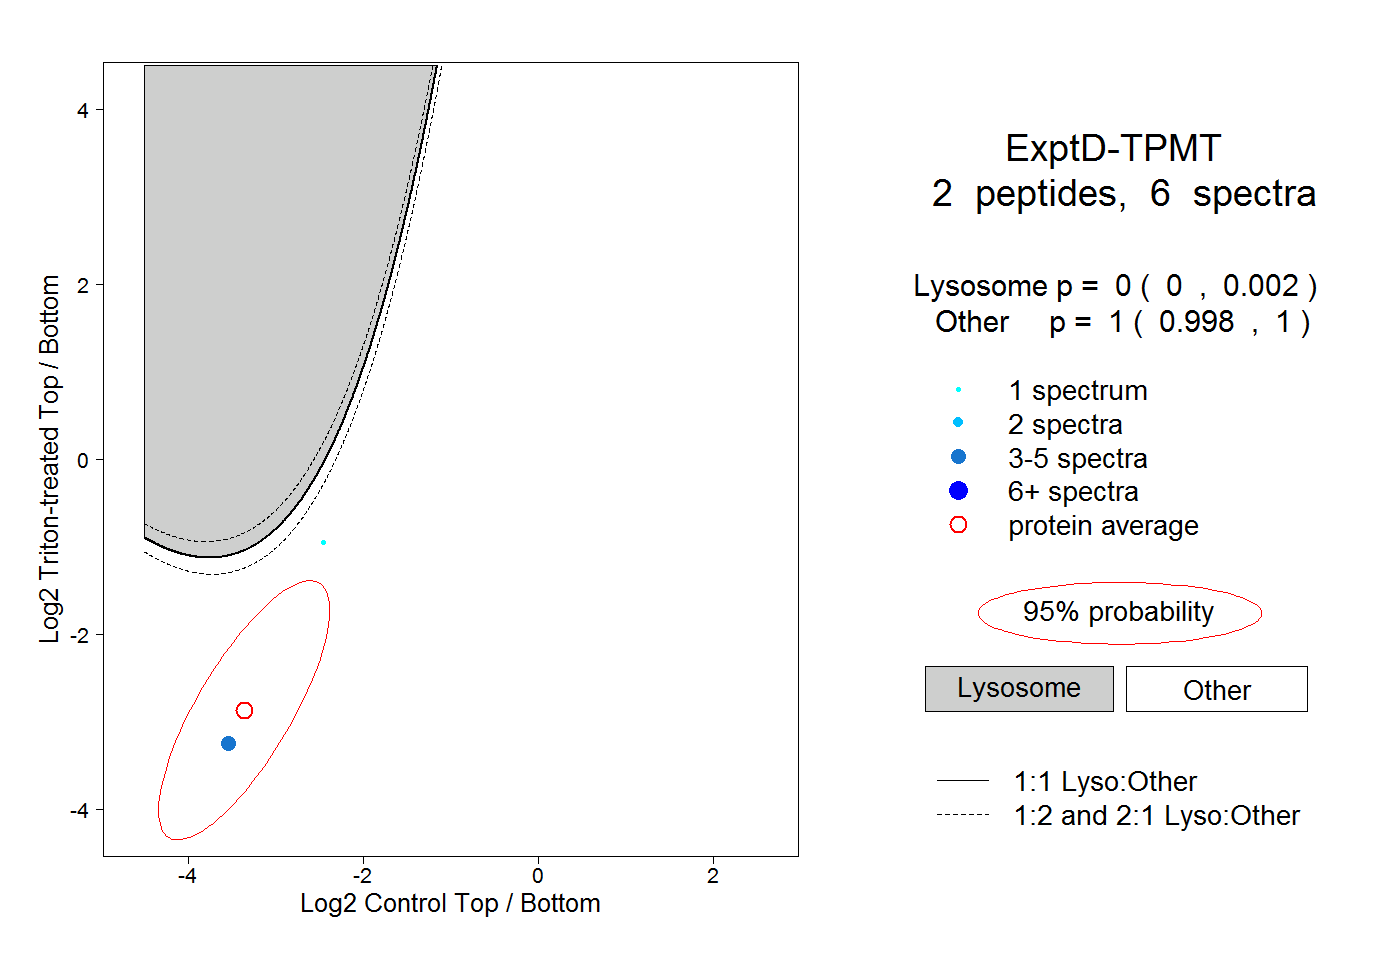
7peptides
spectra
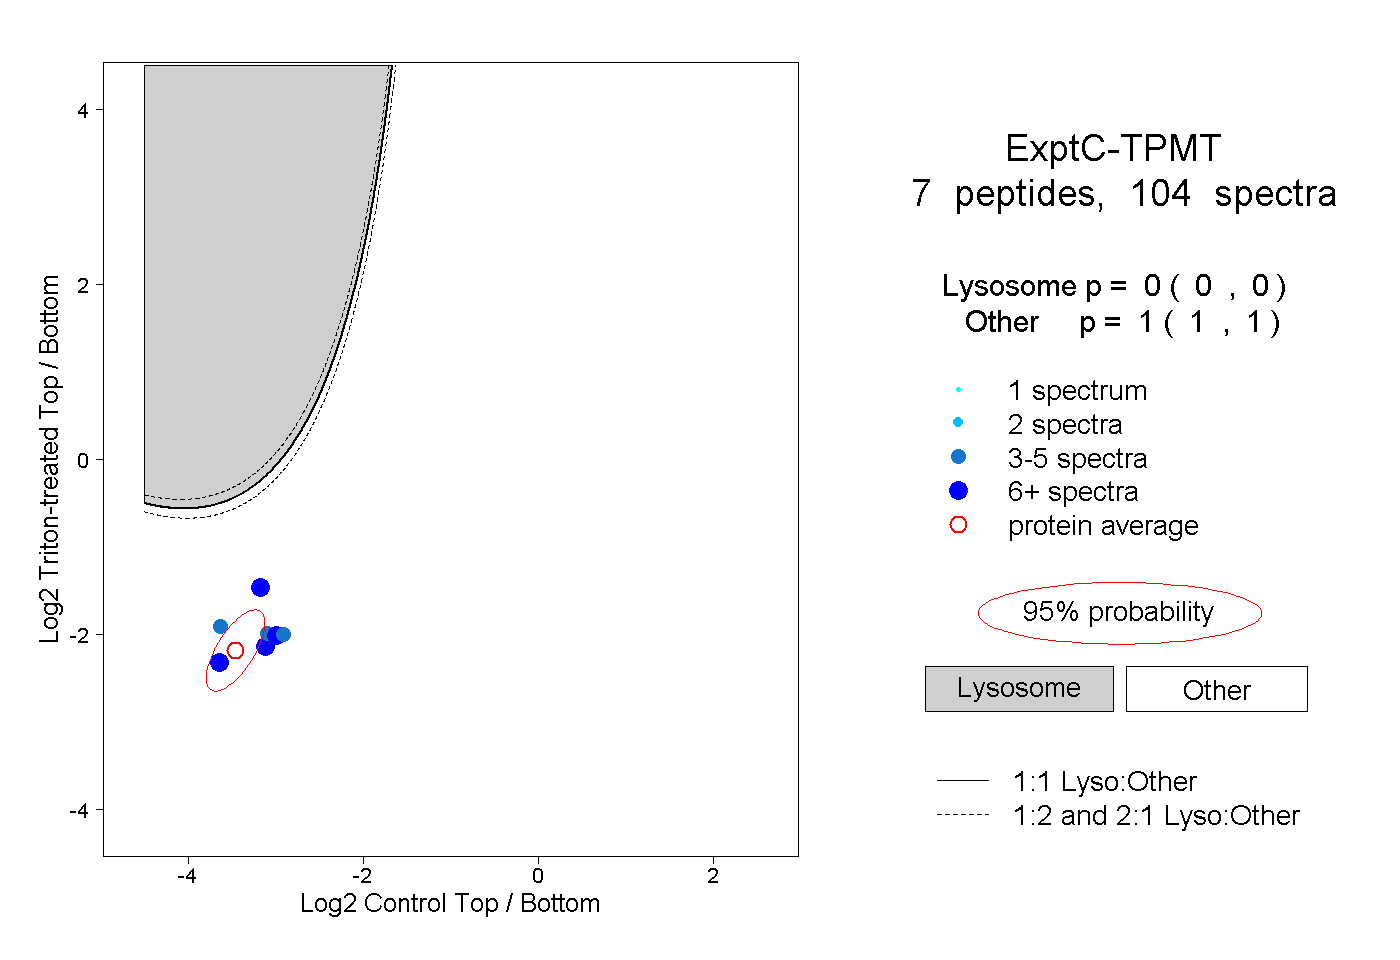
0.000 | 0.000
1.000 | 1.000