 11
11peptides
spectra
0.002 | 0.046
0.000 | 0.000
0.000 | 0.000
0.000 | 0.017
0.000 | 0.000
0.000 | 0.000
0.923 | 0.951
0.011 | 0.040
| Plot | Mito | Lyso | Perox | ER | Golgi | PM | Cytosol | Nucleus | |||||
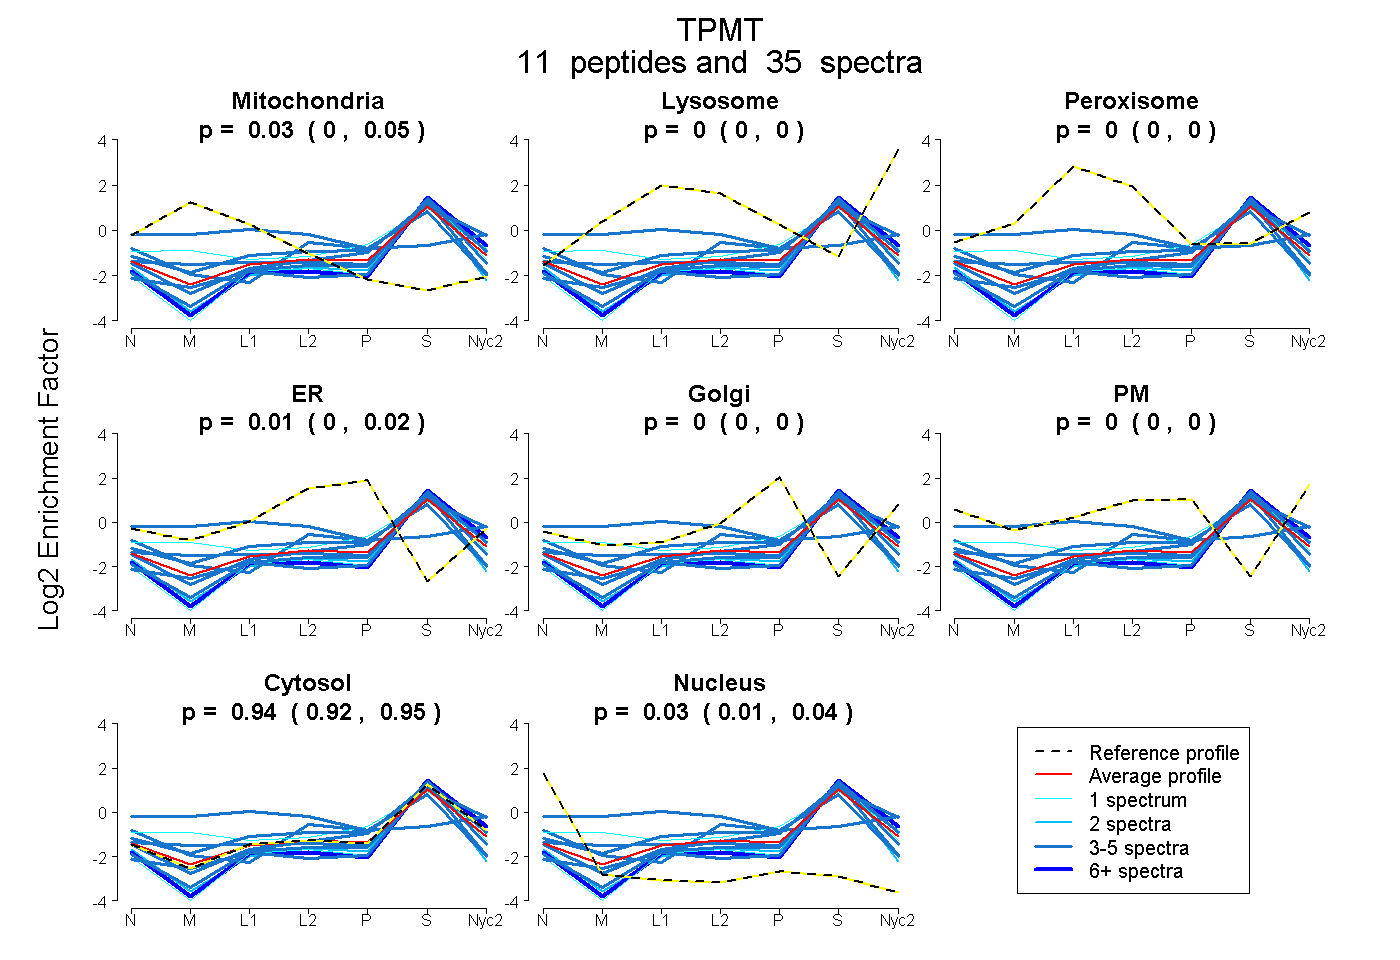
| Expt A |
11 peptides |
35 spectra |
|
0.027 0.002 | 0.046 |
0.000 0.000 | 0.000 |
0.000 0.000 | 0.000 |
0.007 0.000 | 0.017 |
0.000 0.000 | 0.000 |
0.000 0.000 | 0.000 |
0.939 0.923 | 0.951 |
0.027 0.011 | 0.040 |
| 4 spectra, TWGVDYFFEK | 0.000 | 0.090 | 0.000 | 0.000 | 0.009 | 0.066 | 0.835 | 0.000 | ||
| 2 spectra, EHPDAEVQK | 0.000 | 0.000 | 0.000 | 0.000 | 0.000 | 0.000 | 0.887 | 0.113 | ||
| 3 spectra, LYLLTEK | 0.000 | 0.000 | 0.000 | 0.000 | 0.000 | 0.000 | 0.961 | 0.039 | ||
| 4 spectra, VFFPLCGK | 0.000 | 0.000 | 0.000 | 0.000 | 0.000 | 0.000 | 0.930 | 0.070 | ||
| 1 spectrum, HIAFHQEQGHQLLK | 0.000 | 0.000 | 0.000 | 0.000 | 0.000 | 0.000 | 0.979 | 0.021 | ||
| 3 spectra, VLTLDDWQDK | 0.000 | 0.000 | 0.000 | 0.000 | 0.000 | 0.000 | 1.000 | 0.000 | ||
| 3 spectra, GHTVVGVEISEIGIR | 0.000 | 0.000 | 0.000 | 0.116 | 0.000 | 0.000 | 0.757 | 0.127 | ||
| 1 spectrum, HTGPPFYVPDAELK | 0.133 | 0.001 | 0.030 | 0.000 | 0.119 | 0.000 | 0.718 | 0.000 | ||
| 6 spectra, GALVAVNPGDR | 0.000 | 0.000 | 0.000 | 0.000 | 0.000 | 0.000 | 0.993 | 0.007 | ||
| 3 spectra, HFDTFLK | 0.125 | 0.000 | 0.000 | 0.000 | 0.000 | 0.000 | 0.875 | 0.000 | ||
| 5 spectra, SLGIK | 0.261 | 0.000 | 0.172 | 0.000 | 0.000 | 0.242 | 0.324 | 0.000 |
| Plot | Mito | Lyso or Perox | ER | Golgi | PM | Cytosol | Nucleus | ||||||
| Expt B |
7 peptides |
12 spectra |
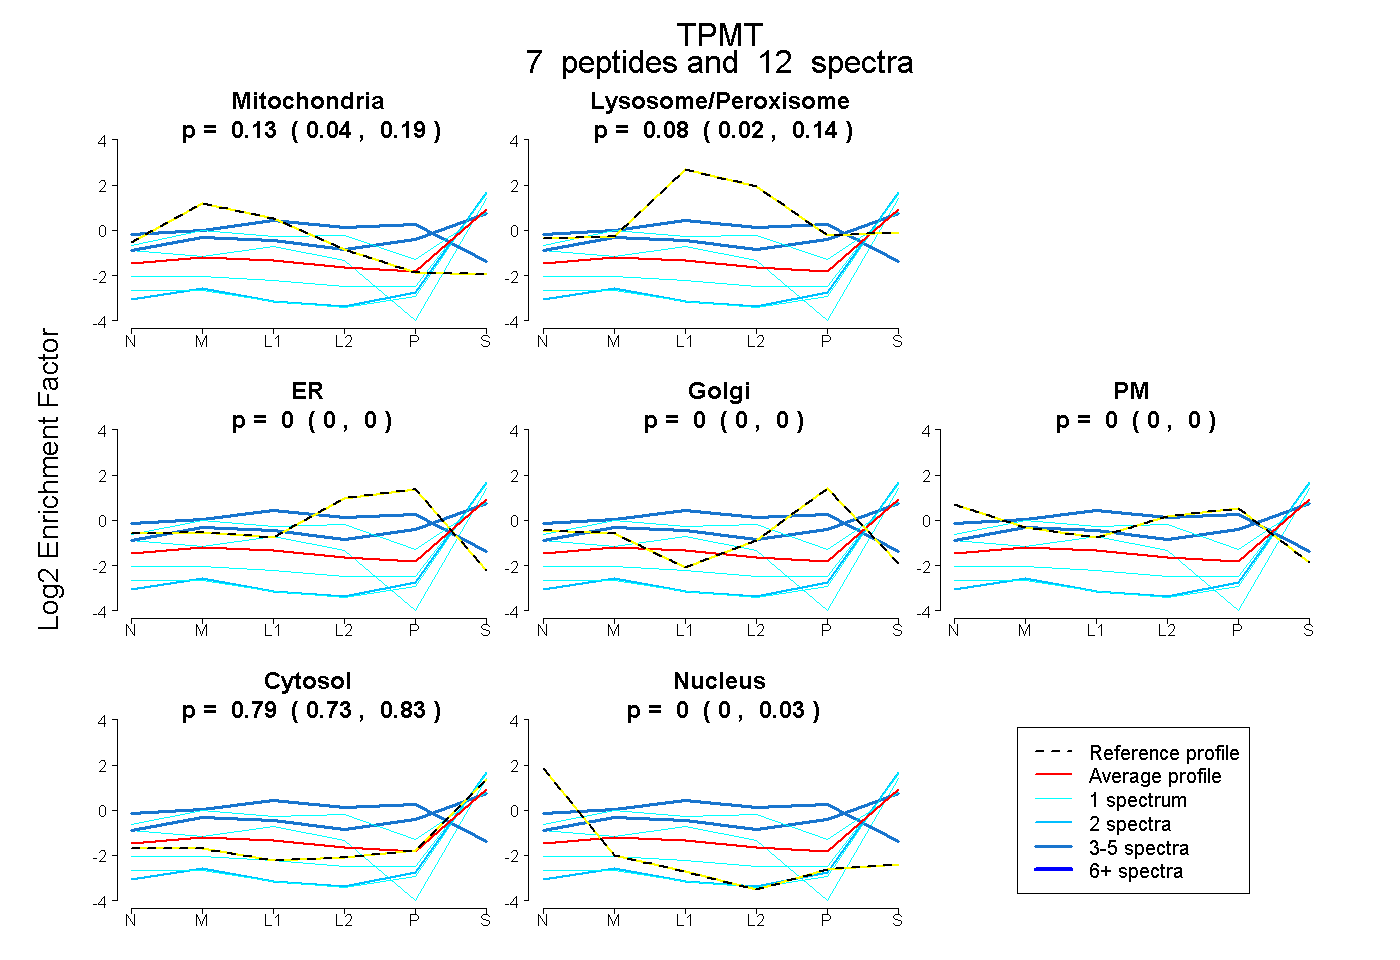 |
0.127 0.043 | 0.189 |
0.082 0.021 | 0.144 |
0.000 0.000 | 0.000 |
0.000 0.000 | 0.001 |
0.000 0.000 | 0.000 |
0.791 0.735 | 0.828 |
0.000 0.000 | 0.034 |
|||
| Plot | Lyso | Other | |||||||||||
| Expt C |
7 peptides |
104 spectra |
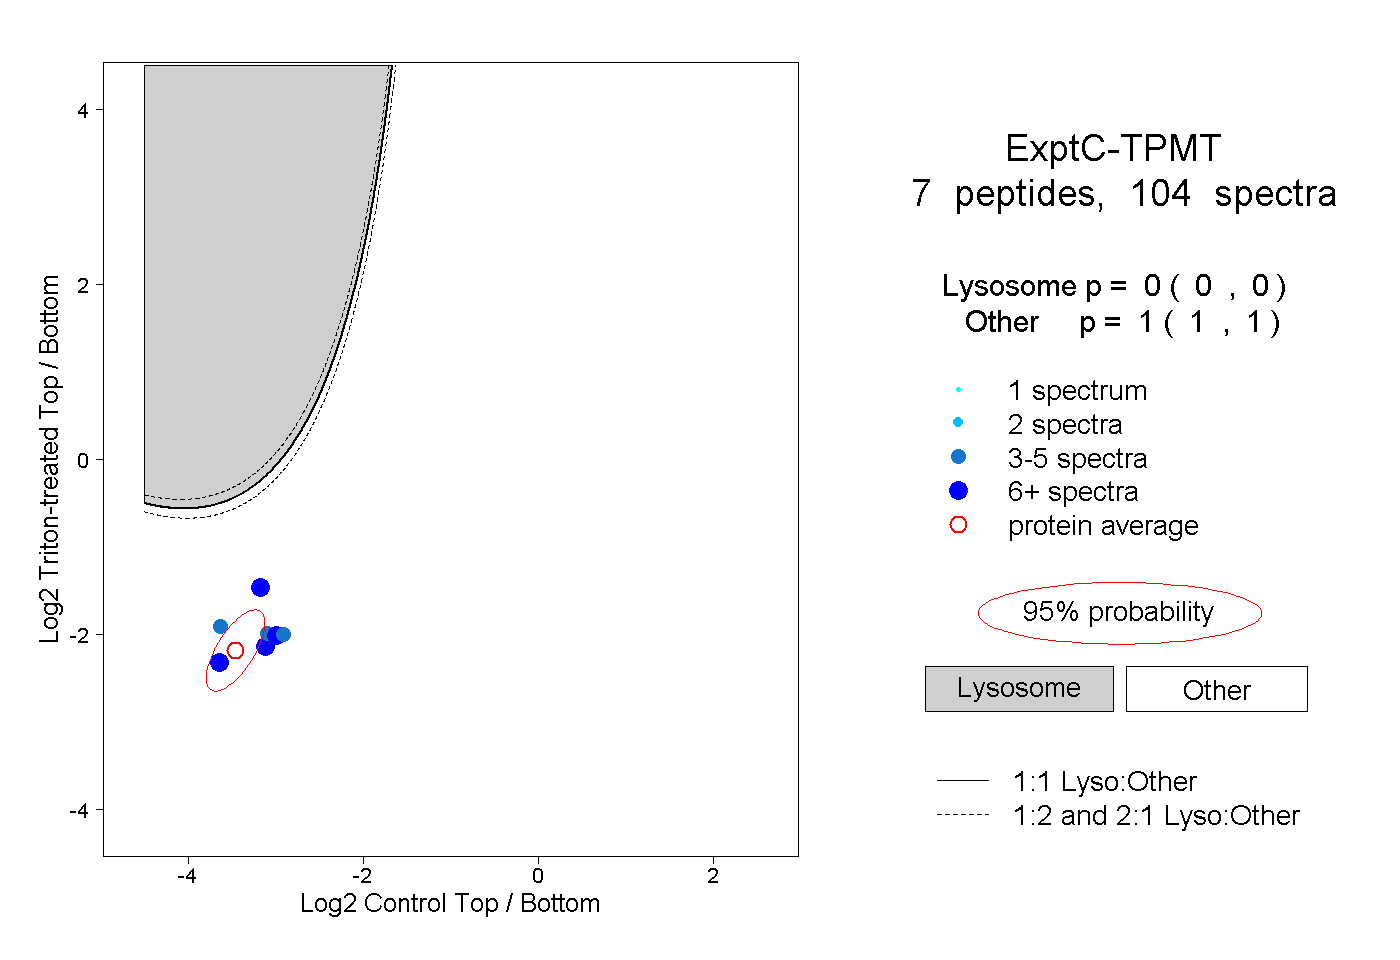 |
0.000 0.000 | 0.000 |
1.000 1.000 | 1.000 |
||||||||
| Plot | Lyso | Other | |||||||||||
| Expt D |
2 peptides |
6 spectra |
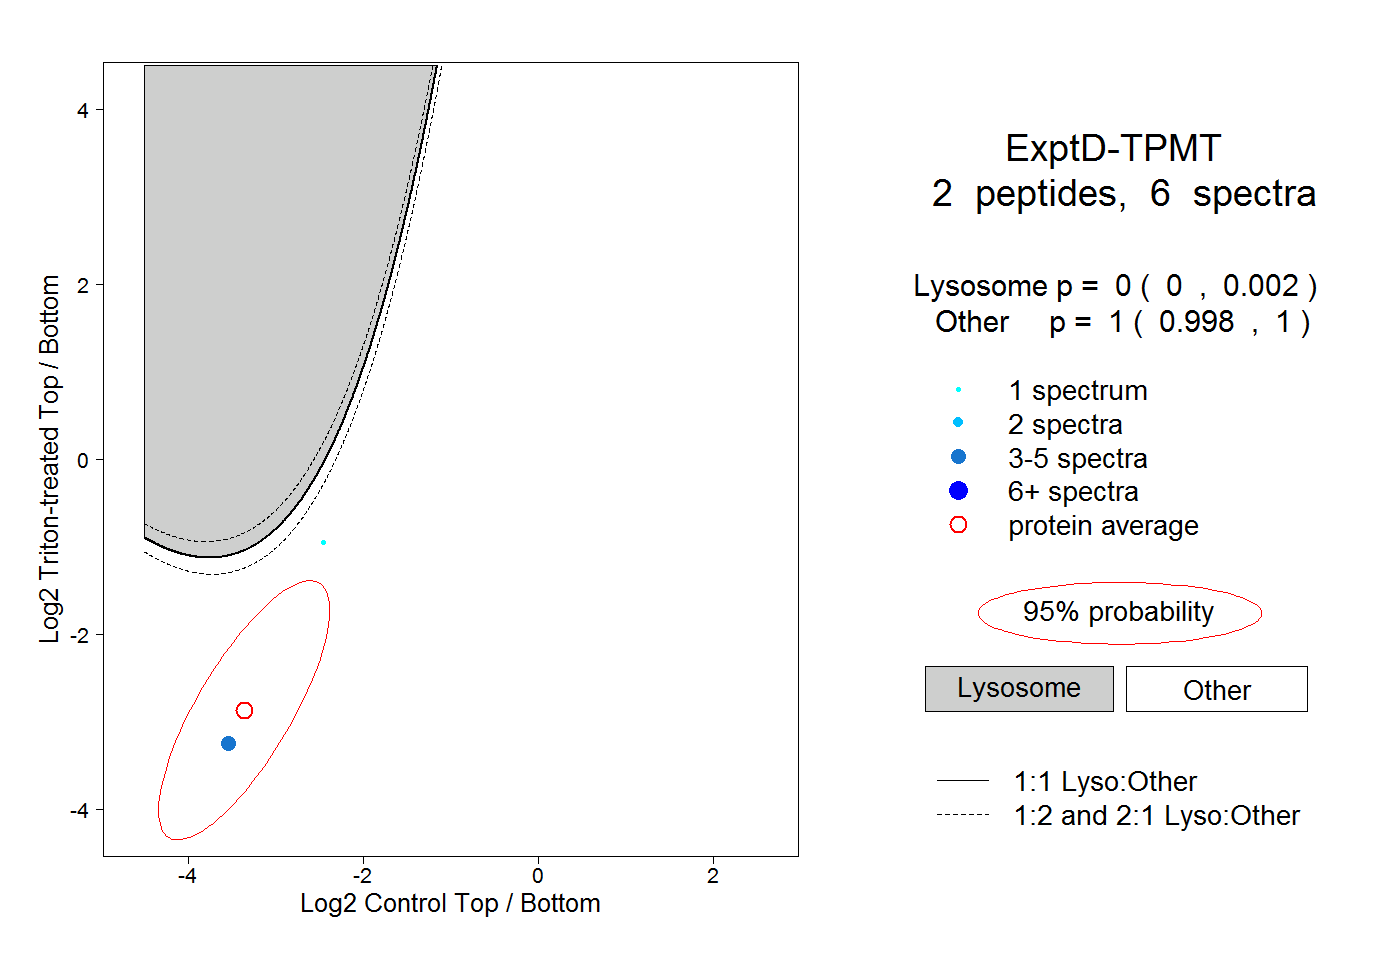 |
0.000 0.000 | 0.002 |
1.000 0.998 | 1.000 |