 4
4peptides
spectra
0.000 | 0.000
0.000 | 0.000
0.294 | 0.436
0.033 | 0.283
0.000 | 0.000
0.000 | 0.240
0.288 | 0.386
0.000 | 0.000
6peptides
spectra
0.000 | 0.000
1.000 | 1.000
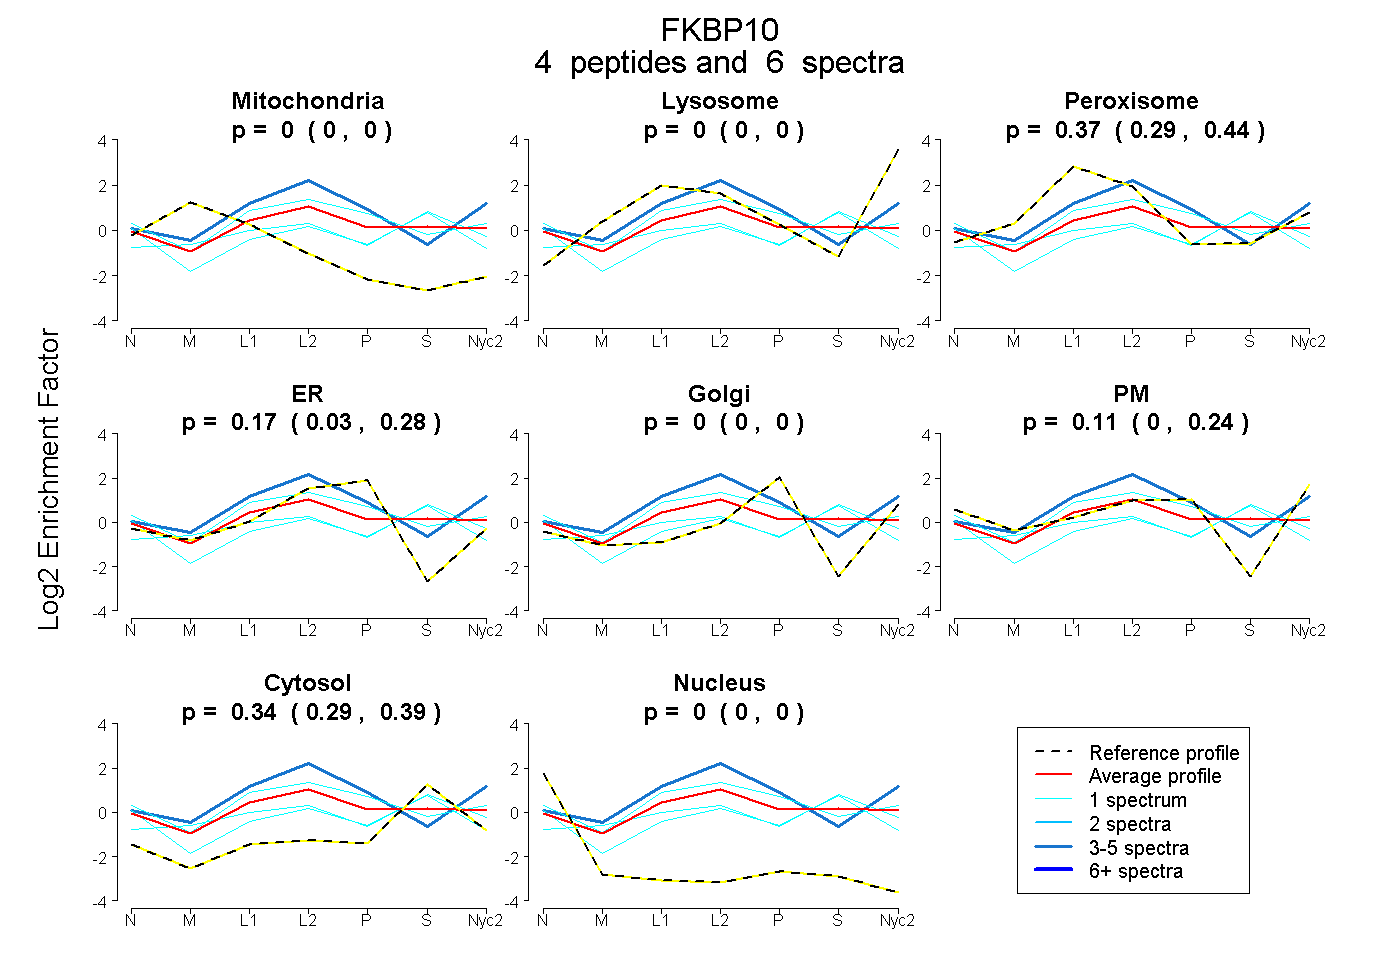
| Plot | Mito | Lyso | Perox | ER | Golgi | PM | Cytosol | Nucleus | |||||
| Expt A |
4 peptides |
6 spectra |
|
0.000 0.000 | 0.000 |
0.000 0.000 | 0.000 |
0.374 0.294 | 0.436 |
0.173 0.033 | 0.283 |
0.000 0.000 | 0.000 |
0.113 0.000 | 0.240 |
0.340 0.288 | 0.386 |
0.000 0.000 | 0.000 |
||
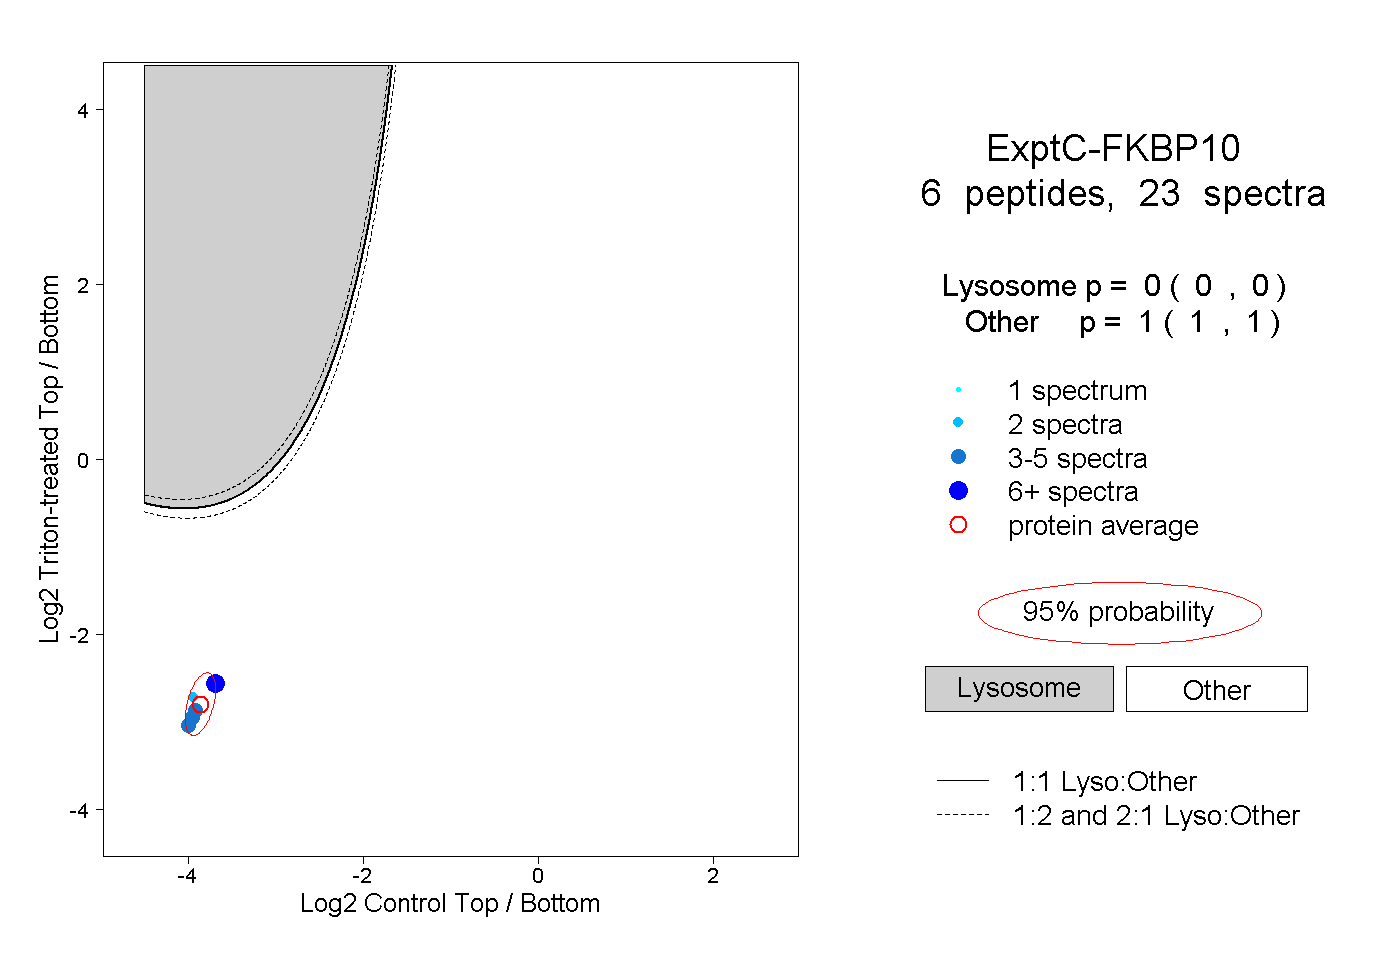
| Plot | Lyso | Other | |||||||||||
| Expt C |
6 peptides |
23 spectra |
|
0.000 0.000 | 0.000 |
1.000 1.000 | 1.000 |
| 4 spectra, VIEGLDR | 0.000 | 1.000 | ||||||||
| 2 spectra, IGDFIR | 0.000 | 1.000 | ||||||||
| 1 spectrum, GGTYDTYIGSGWLIK | 0.000 | 1.000 | ||||||||
| 4 spectra, EVQMGDFVR | 0.000 | 1.000 | ||||||||
| 5 spectra, AQVNEGK | 0.000 | 1.000 | ||||||||
| 7 spectra, NSDFVR | 0.000 | 1.000 |
| Plot | Lyso | Other | |||||||||||
| Expt D |
1 peptide |
2 spectra |
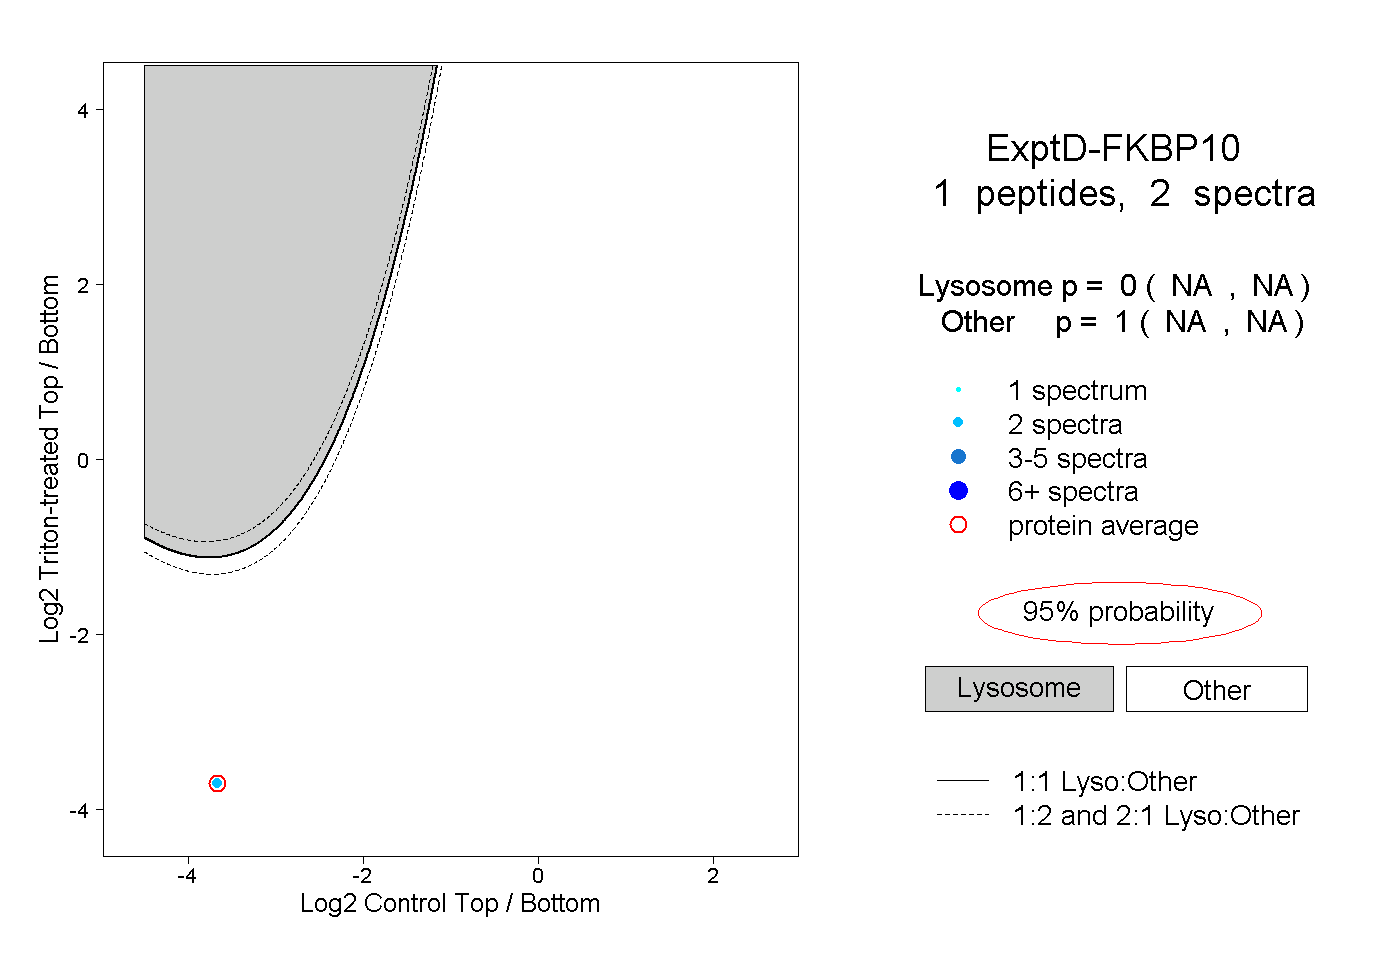 |
0.000 NA | NA |
1.000 NA | NA |