12
12peptides
spectra
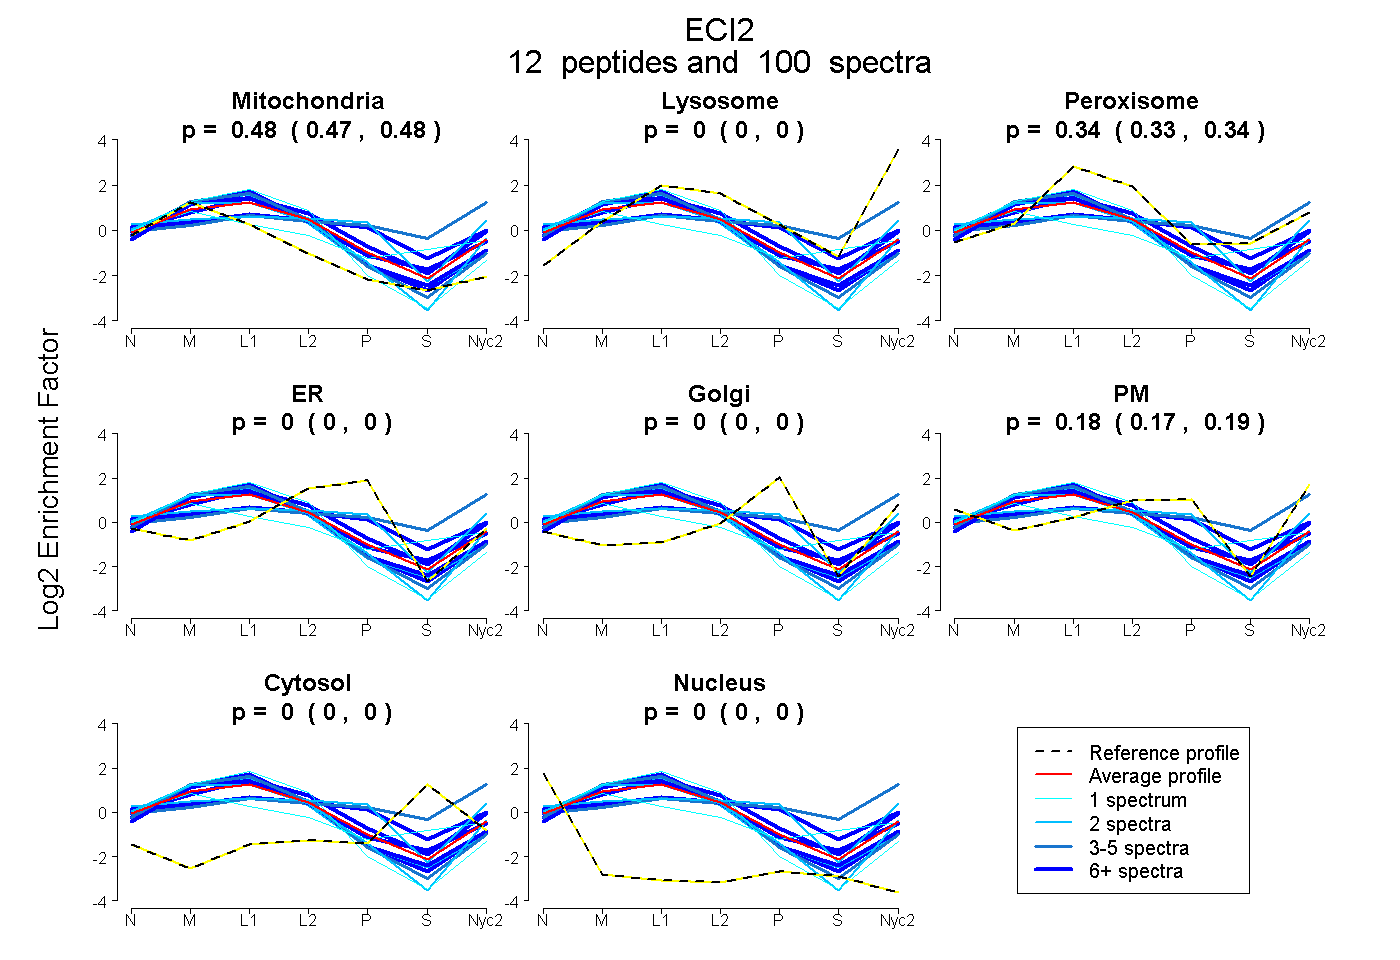
0.471 | 0.484
0.000 | 0.000
0.328 | 0.345
0.000 | 0.000
0.000 | 0.000
0.175 | 0.193
0.000 | 0.000
0.000 | 0.000
10peptides
spectra
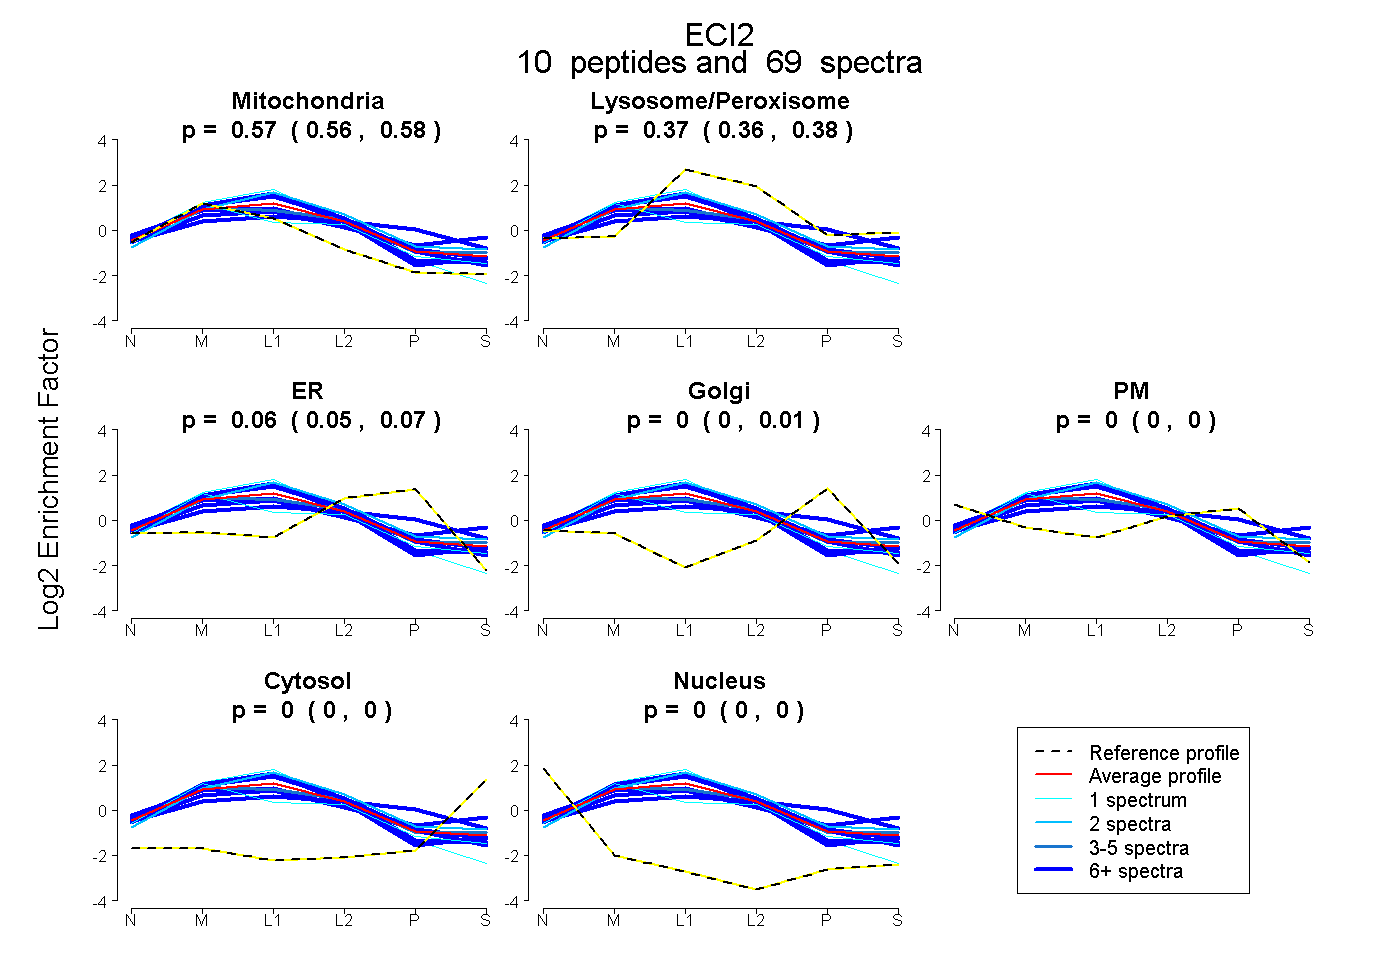
0.560 | 0.576
0.362 | 0.378
0.046 | 0.067
0.000 | 0.007
0.000 | 0.000
0.000 | 0.000
0.000 | 0.000
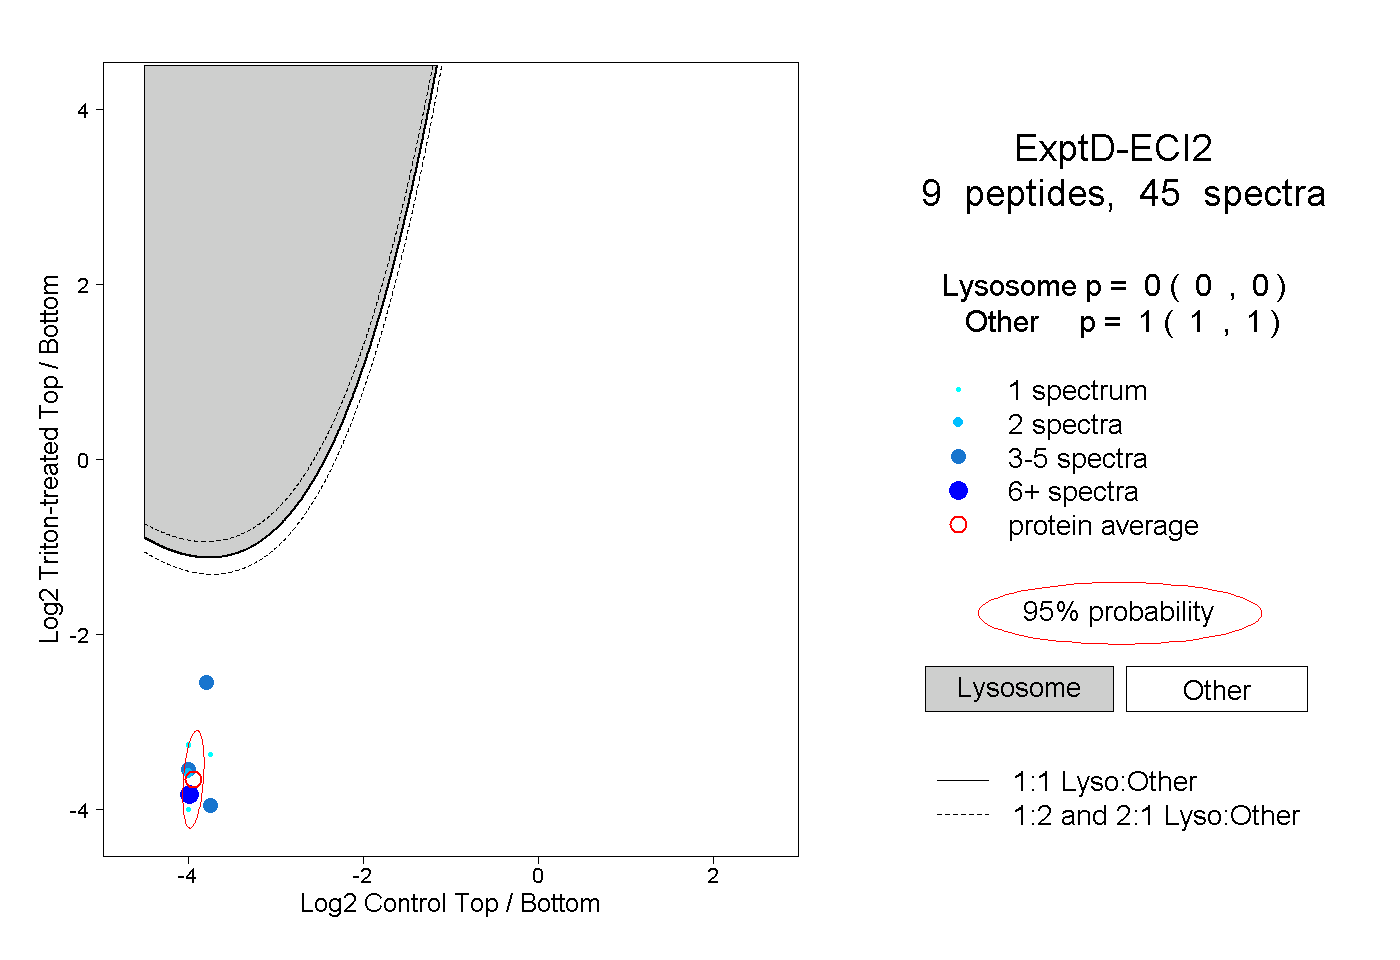
13peptides
spectra
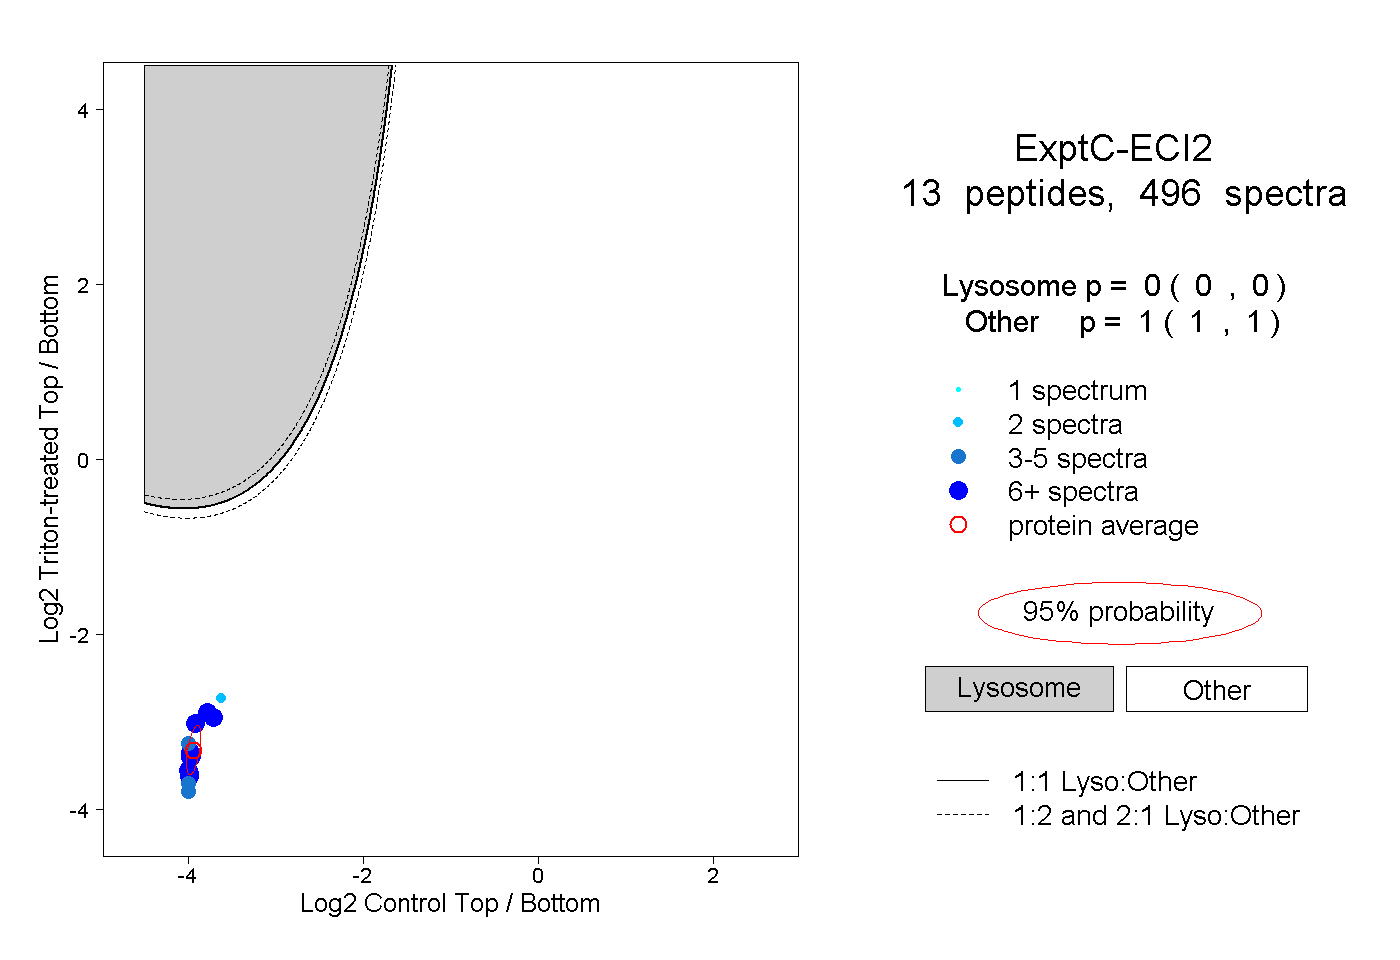
0.000 | 0.000
1.000 | 1.000