 12
12peptides
spectra
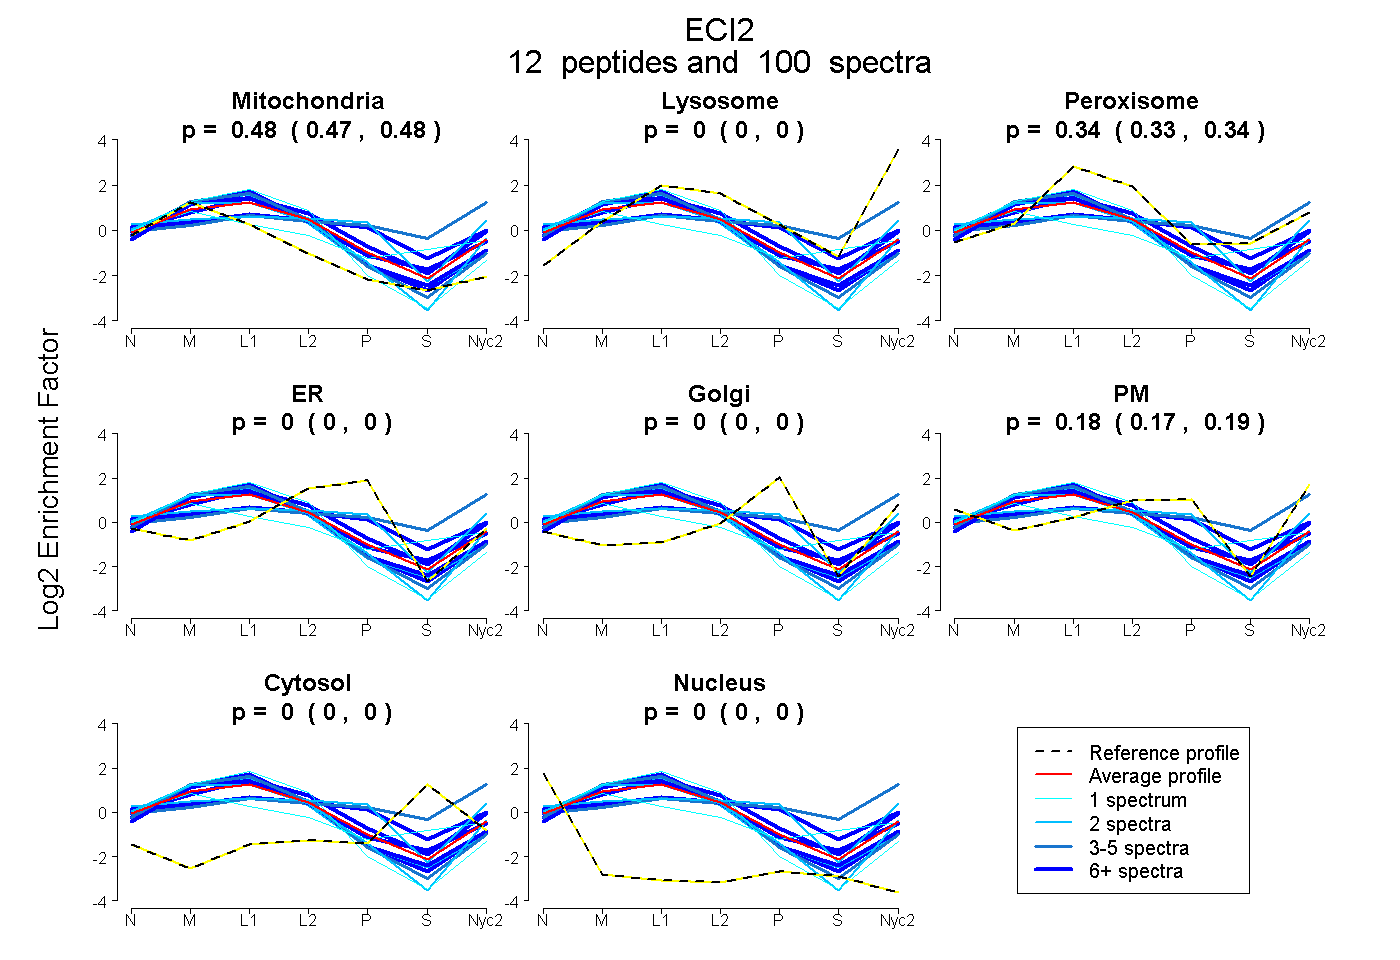
0.471 | 0.484
0.000 | 0.000
0.328 | 0.345
0.000 | 0.000
0.000 | 0.000
0.175 | 0.193
0.000 | 0.000
0.000 | 0.000
| Plot | Mito | Lyso | Perox | ER | Golgi | PM | Cytosol | Nucleus | |||||
| Expt A |
12 peptides |
100 spectra |
|
0.478 0.471 | 0.484 |
0.000 0.000 | 0.000 |
0.338 0.328 | 0.345 |
0.000 0.000 | 0.000 |
0.000 0.000 | 0.000 |
0.184 0.175 | 0.193 |
0.000 0.000 | 0.000 |
0.000 0.000 | 0.000 |
| 24 spectra, LPPNSMR | 0.496 | 0.055 | 0.449 | 0.000 | 0.000 | 0.000 | 0.000 | 0.000 | ||
| 2 spectra, GILVTSEGGITK | 0.629 | 0.000 | 0.371 | 0.000 | 0.000 | 0.000 | 0.000 | 0.000 | ||
| 7 spectra, LHAVNEEECTTLR | 0.234 | 0.000 | 0.324 | 0.015 | 0.185 | 0.185 | 0.057 | 0.000 | ||
| 15 spectra, ITFNRPSK | 0.599 | 0.000 | 0.373 | 0.002 | 0.000 | 0.026 | 0.000 | 0.000 | ||
| 2 spectra, QNYVDLVSSLSSSSEASSQGK | 0.260 | 0.000 | 0.123 | 0.078 | 0.000 | 0.539 | 0.000 | 0.000 | ||
| 5 spectra, LYALYK | 0.633 | 0.000 | 0.336 | 0.031 | 0.000 | 0.000 | 0.000 | 0.000 | ||
| 3 spectra, LHLGRPAMR | 0.034 | 0.177 | 0.223 | 0.000 | 0.000 | 0.350 | 0.216 | 0.000 | ||
| 1 spectrum, WLSEECINAIMSFVTR | 0.469 | 0.043 | 0.206 | 0.000 | 0.000 | 0.103 | 0.179 | 0.000 | ||
| 1 spectrum, QATEGPCTMPKPGVFDFVNK | 0.671 | 0.000 | 0.329 | 0.000 | 0.000 | 0.000 | 0.000 | 0.000 | ||
| 31 spectra, GAIVLR | 0.599 | 0.000 | 0.384 | 0.000 | 0.000 | 0.017 | 0.000 | 0.000 | ||
| 7 spectra, ATQQDFENAMNQVK | 0.360 | 0.000 | 0.419 | 0.000 | 0.000 | 0.221 | 0.000 | 0.000 | ||
| 2 spectra, NAITFQMYQDIILALK | 0.615 | 0.092 | 0.089 | 0.000 | 0.000 | 0.205 | 0.000 | 0.000 |
| Plot | Mito | Lyso or Perox | ER | Golgi | PM | Cytosol | Nucleus | ||||||
| Expt B |
10 peptides |
69 spectra |
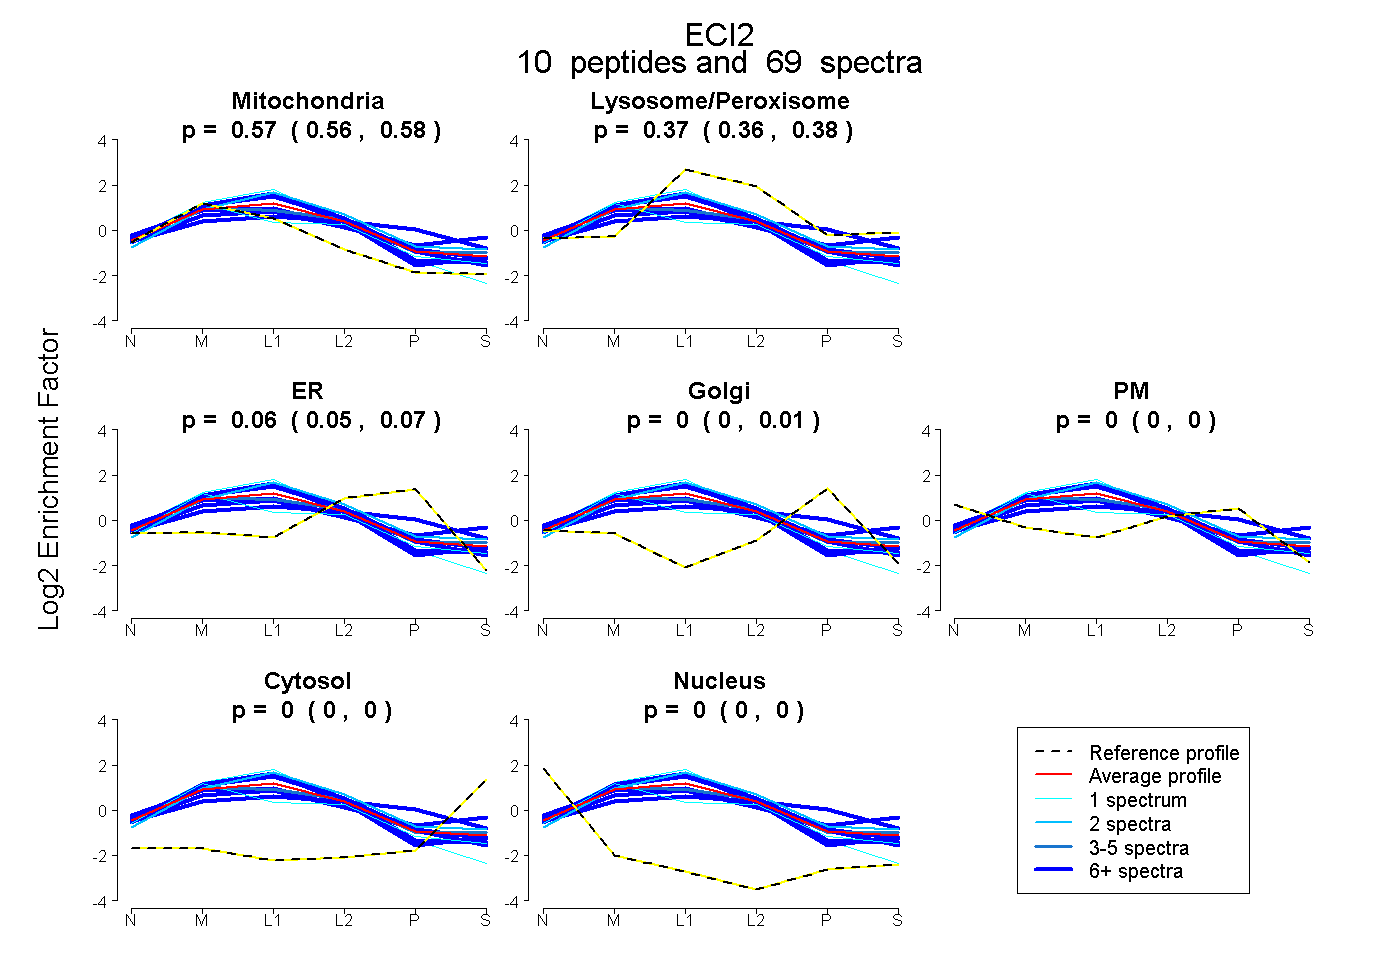 |
0.569 0.560 | 0.576 |
0.370 0.362 | 0.378 |
0.061 0.046 | 0.067 |
0.000 0.000 | 0.007 |
0.000 0.000 | 0.000 |
0.000 0.000 | 0.000 |
0.000 0.000 | 0.000 |
|||
| Plot | Lyso | Other | |||||||||||
| Expt C |
13 peptides |
496 spectra |
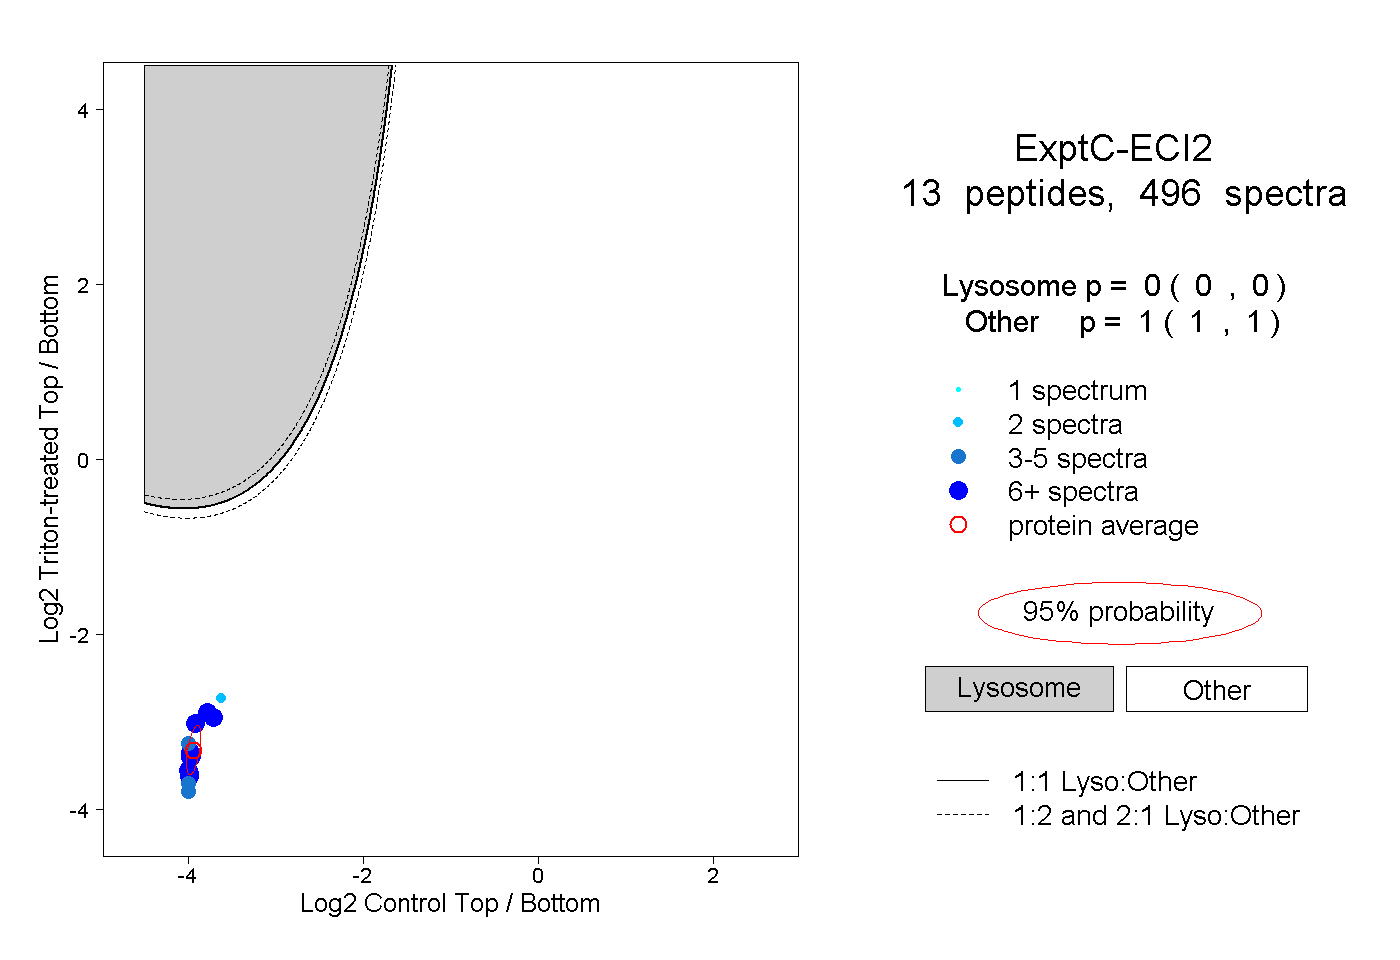 |
0.000 0.000 | 0.000 |
1.000 1.000 | 1.000 |
||||||||
| Plot | Lyso | Other | |||||||||||
| Expt D |
9 peptides |
45 spectra |
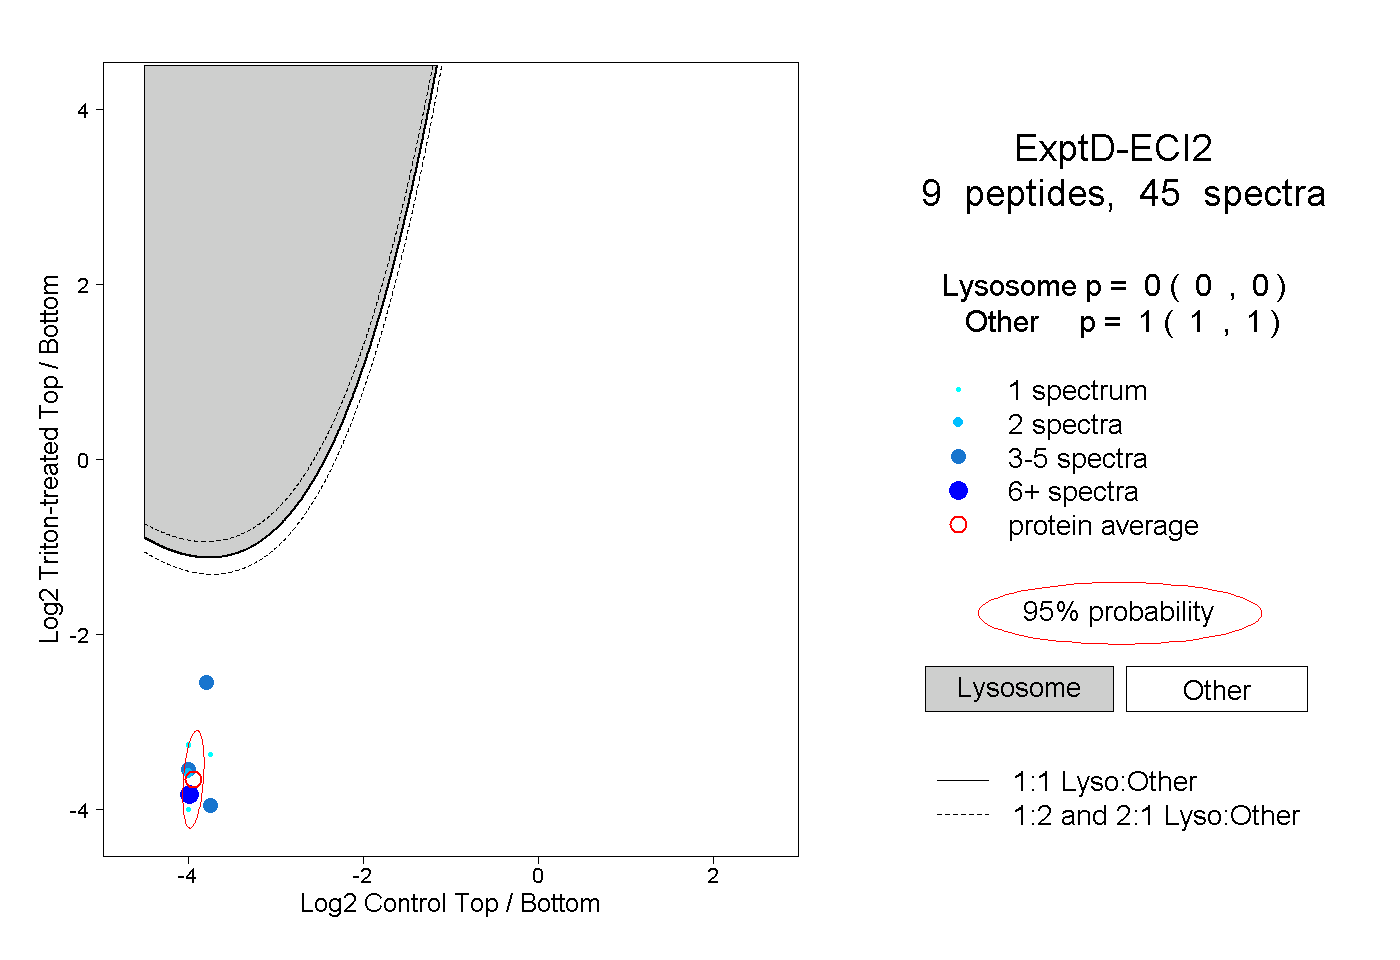 |
0.000 0.000 | 0.000 |
1.000 1.000 | 1.000 |