 19
19peptides
spectra
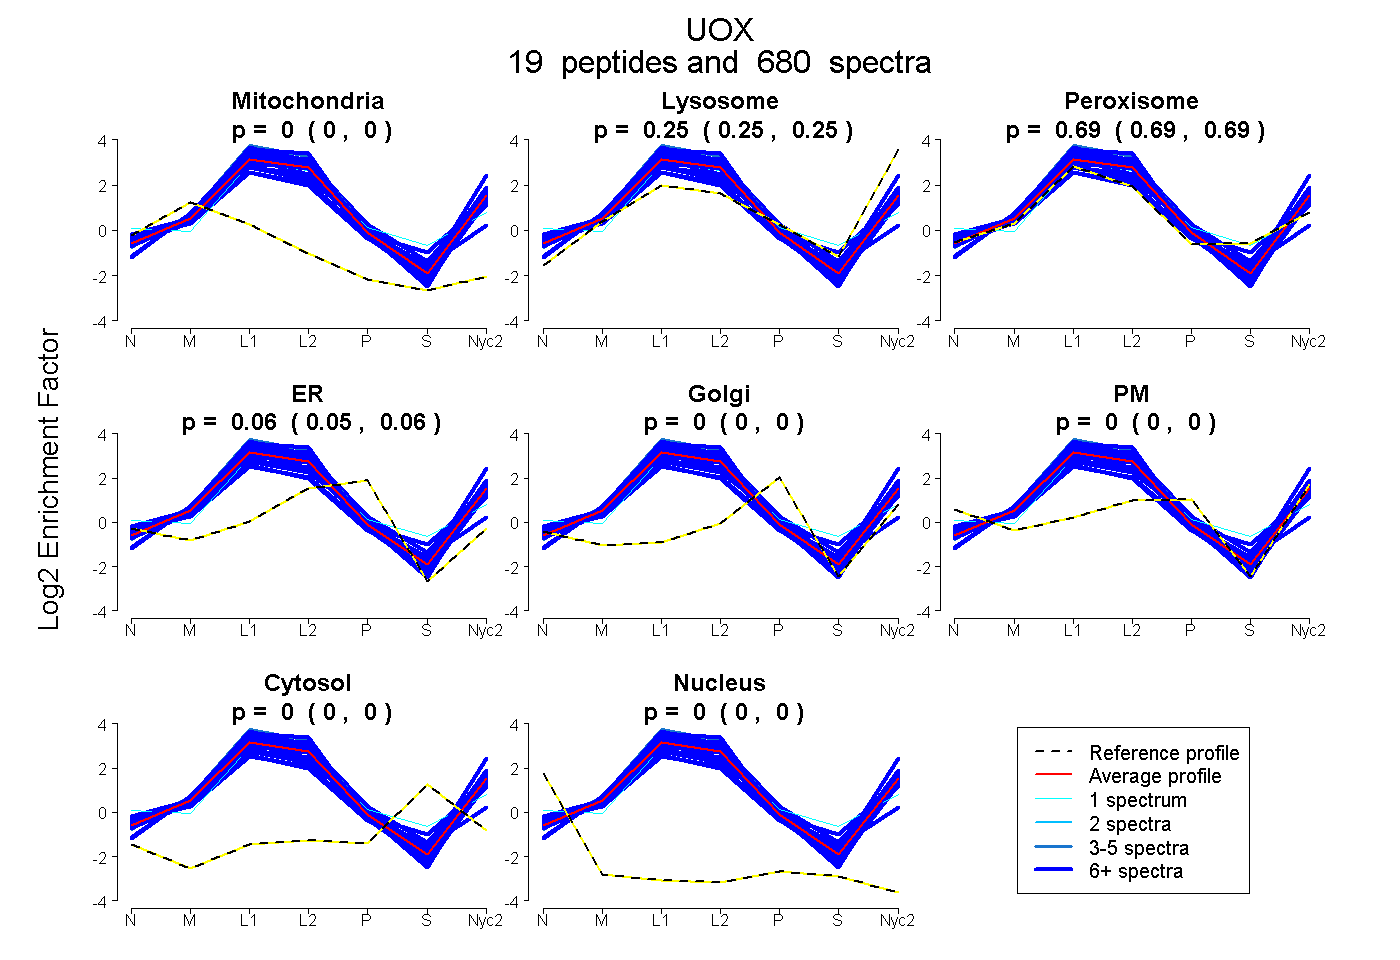
0.000 | 0.000
0.250 | 0.254
0.690 | 0.694
0.054 | 0.057
0.000 | 0.000
0.000 | 0.000
0.000 | 0.000
0.000 | 0.000
19peptides
spectra
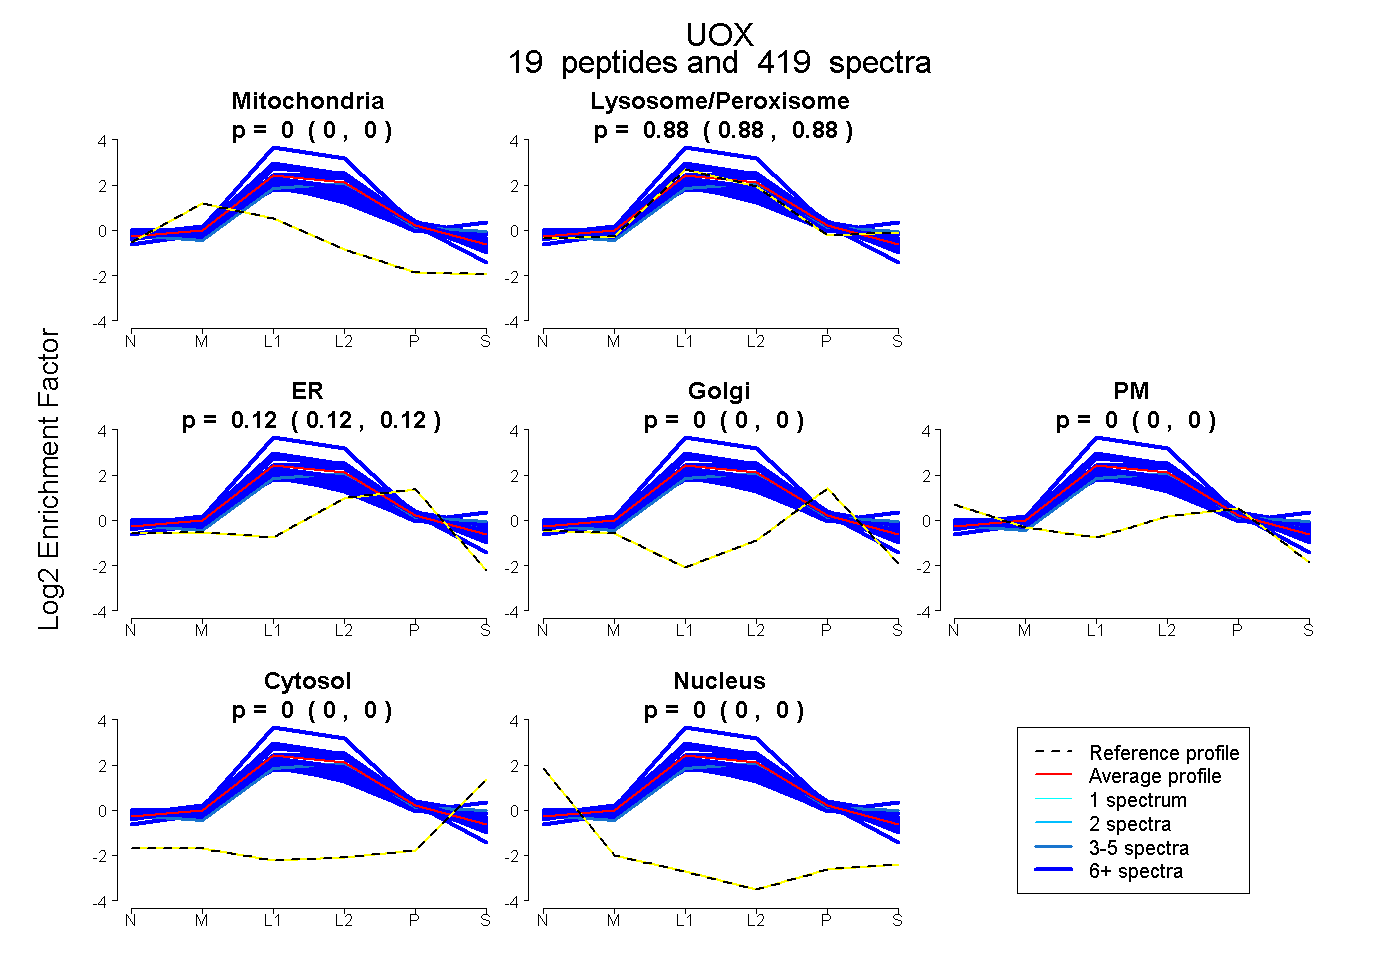
0.000 | 0.000
0.877 | 0.881
0.119 | 0.123
0.000 | 0.000
0.000 | 0.000
0.000 | 0.000
0.000 | 0.000
18peptides
spectra
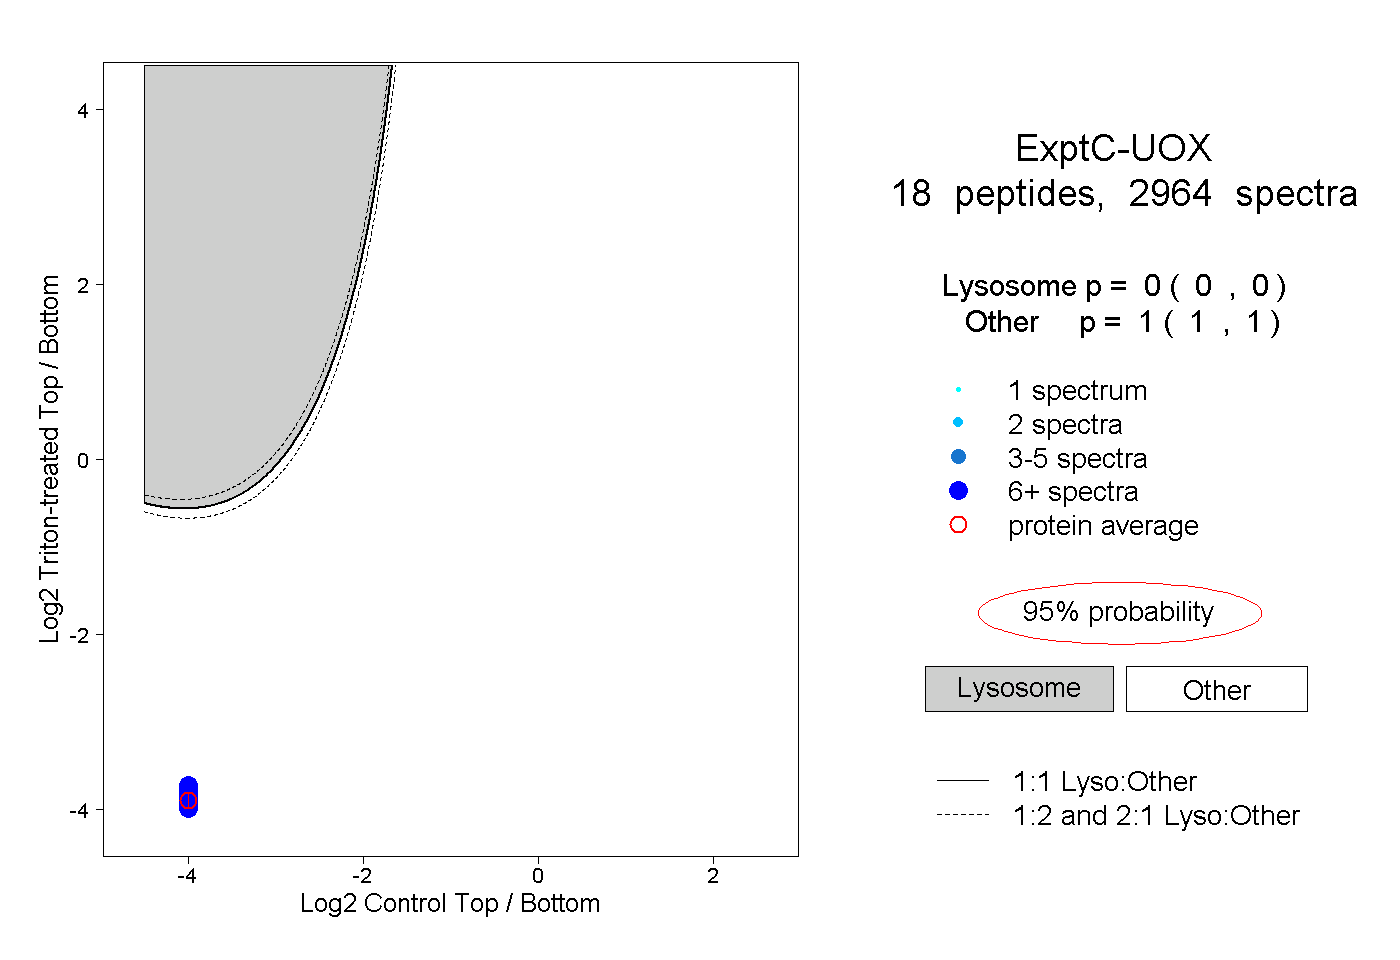
0.000 | 0.000
1.000 | 1.000
17peptides
spectra
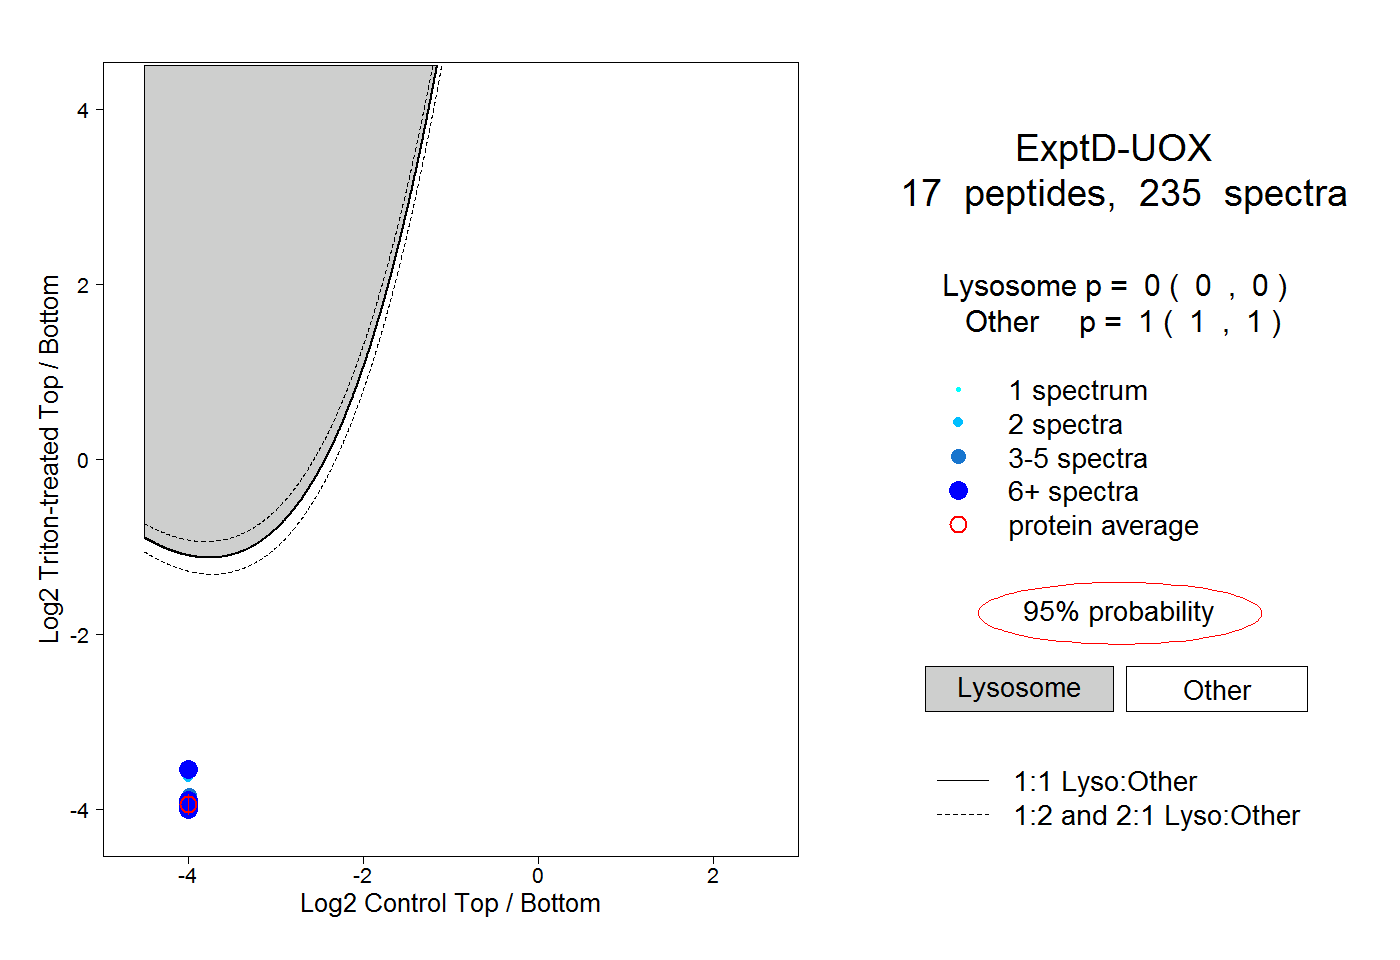
0.000 | 0.000
1.000 | 1.000