 2
2peptides
spectra
0.000 | 0.000
0.481 | 0.574
0.000 | 0.000
0.000 | 0.000
0.000 | 0.084
0.339 | 0.497
0.000 | 0.000
0.000 | 0.000
10peptides
spectra
0.000 | 0.014
0.986 | 1.000
| Plot | Mito | Lyso | Perox | ER | Golgi | PM | Cytosol | Nucleus | |||||
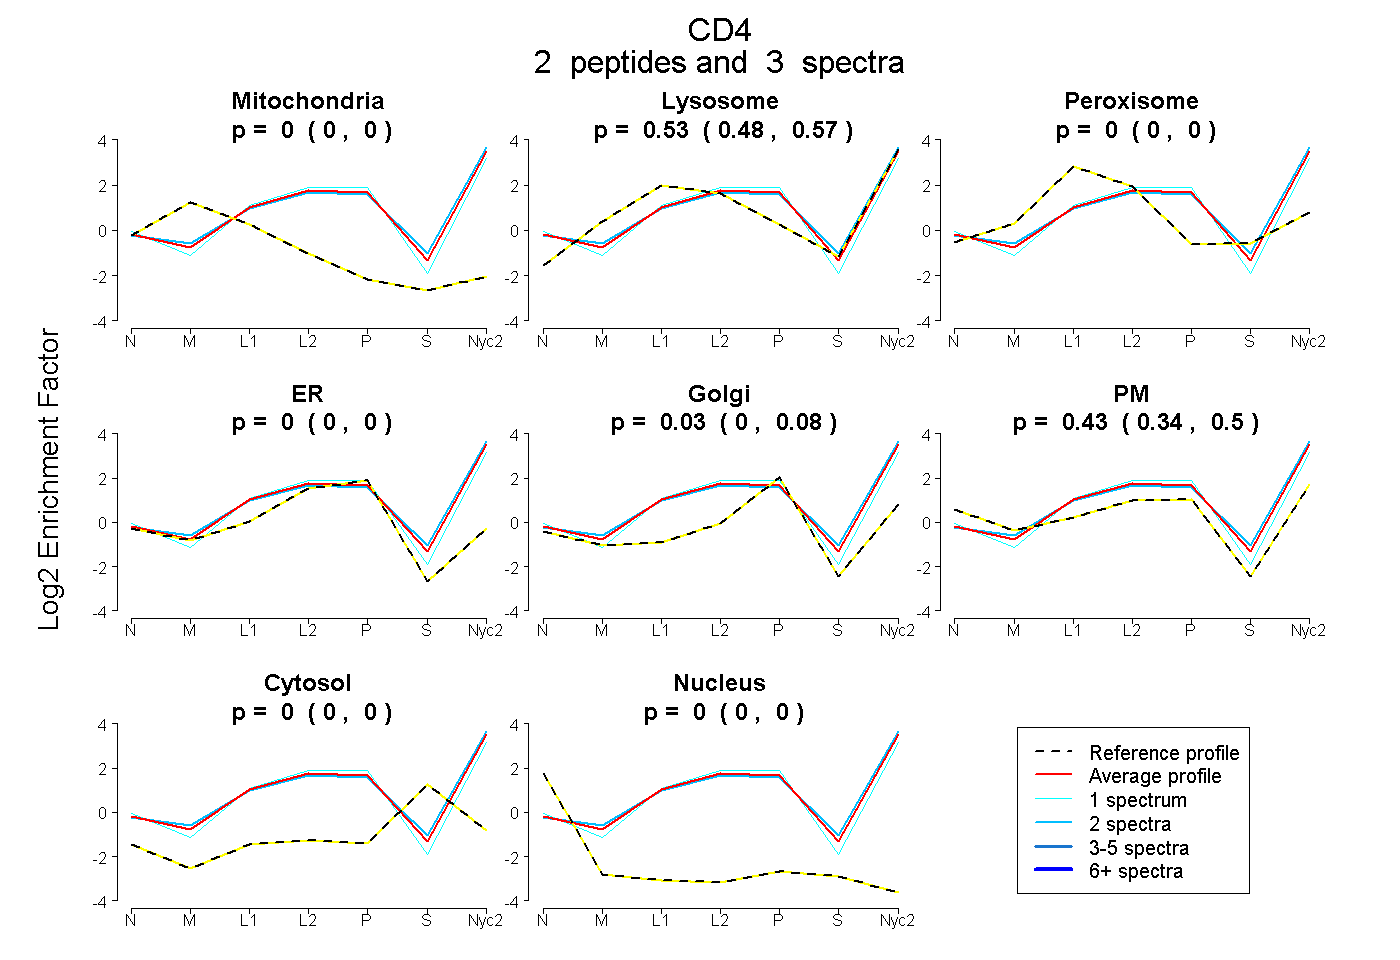
| Expt A |
2 peptides |
3 spectra |
|
0.000 0.000 | 0.000 |
0.532 0.481 | 0.574 |
0.000 0.000 | 0.000 |
0.000 0.000 | 0.000 |
0.033 0.000 | 0.084 |
0.435 0.339 | 0.497 |
0.000 0.000 | 0.000 |
0.000 0.000 | 0.000 |
||
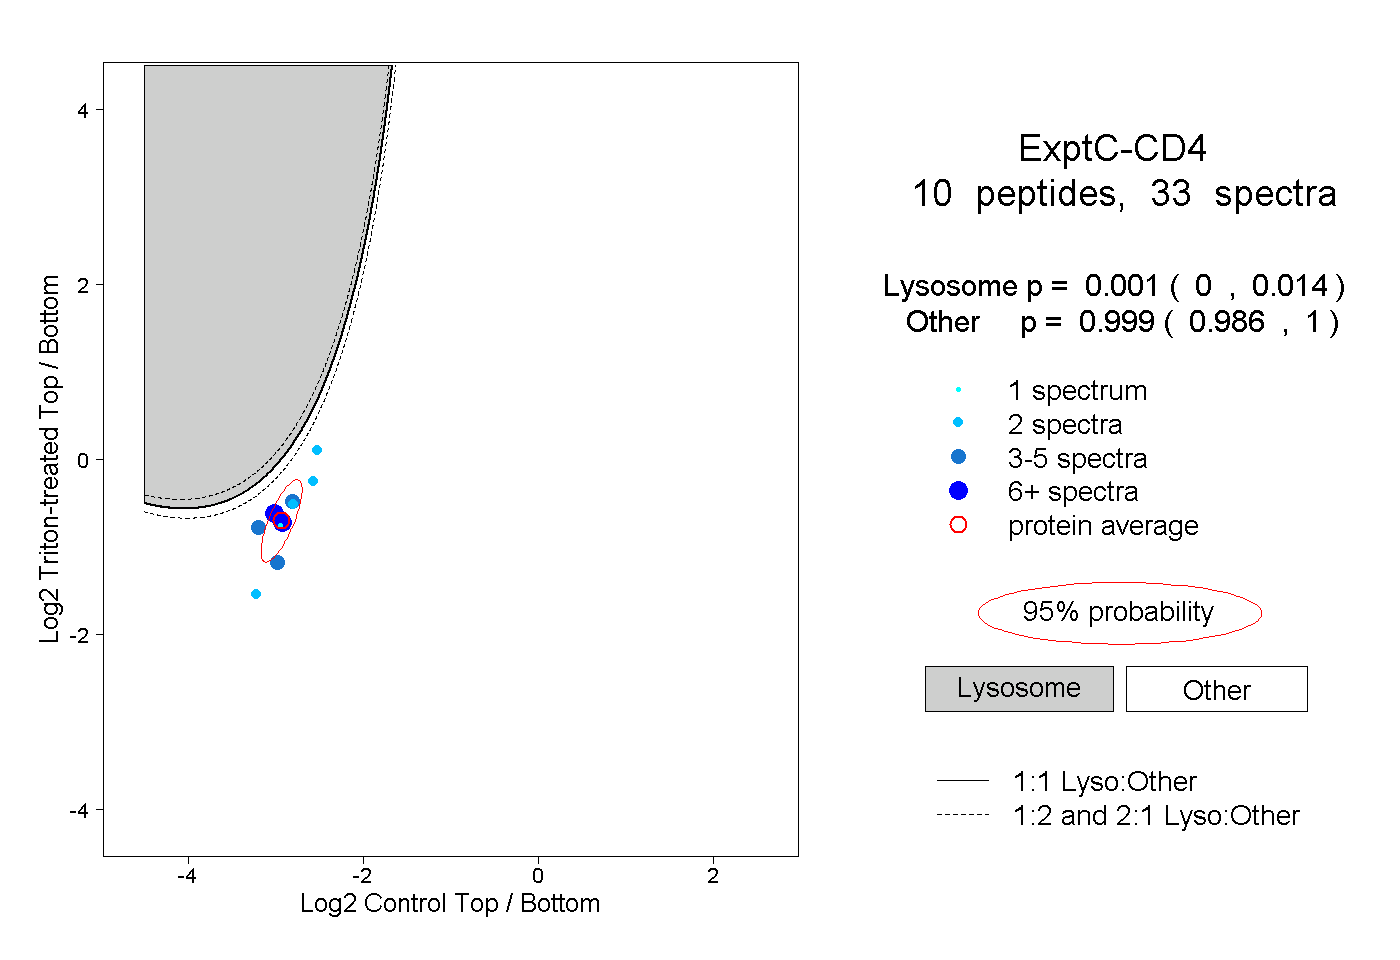
| Plot | Lyso | Other | |||||||||||
| Expt C |
10 peptides |
33 spectra |
|
0.001 0.000 | 0.014 |
0.999 0.986 | 1.000 |