 2
2peptides
spectra
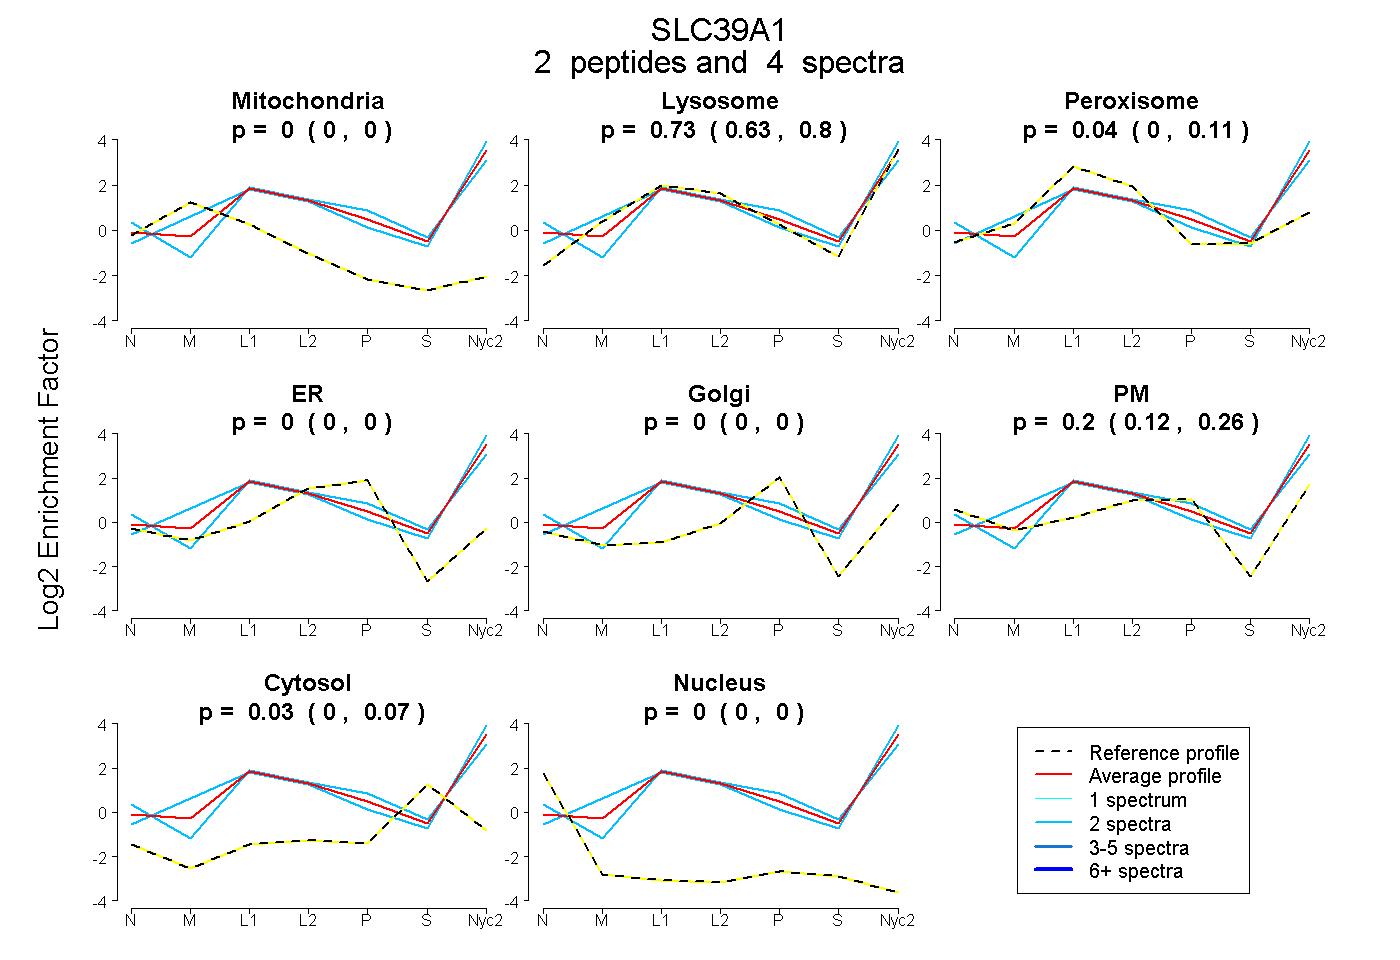
0.000 | 0.000
0.634 | 0.802
0.000 | 0.113
0.000 | 0.000
0.000 | 0.000
0.121 | 0.258
0.000 | 0.070
0.000 | 0.000
1peptide
spectra
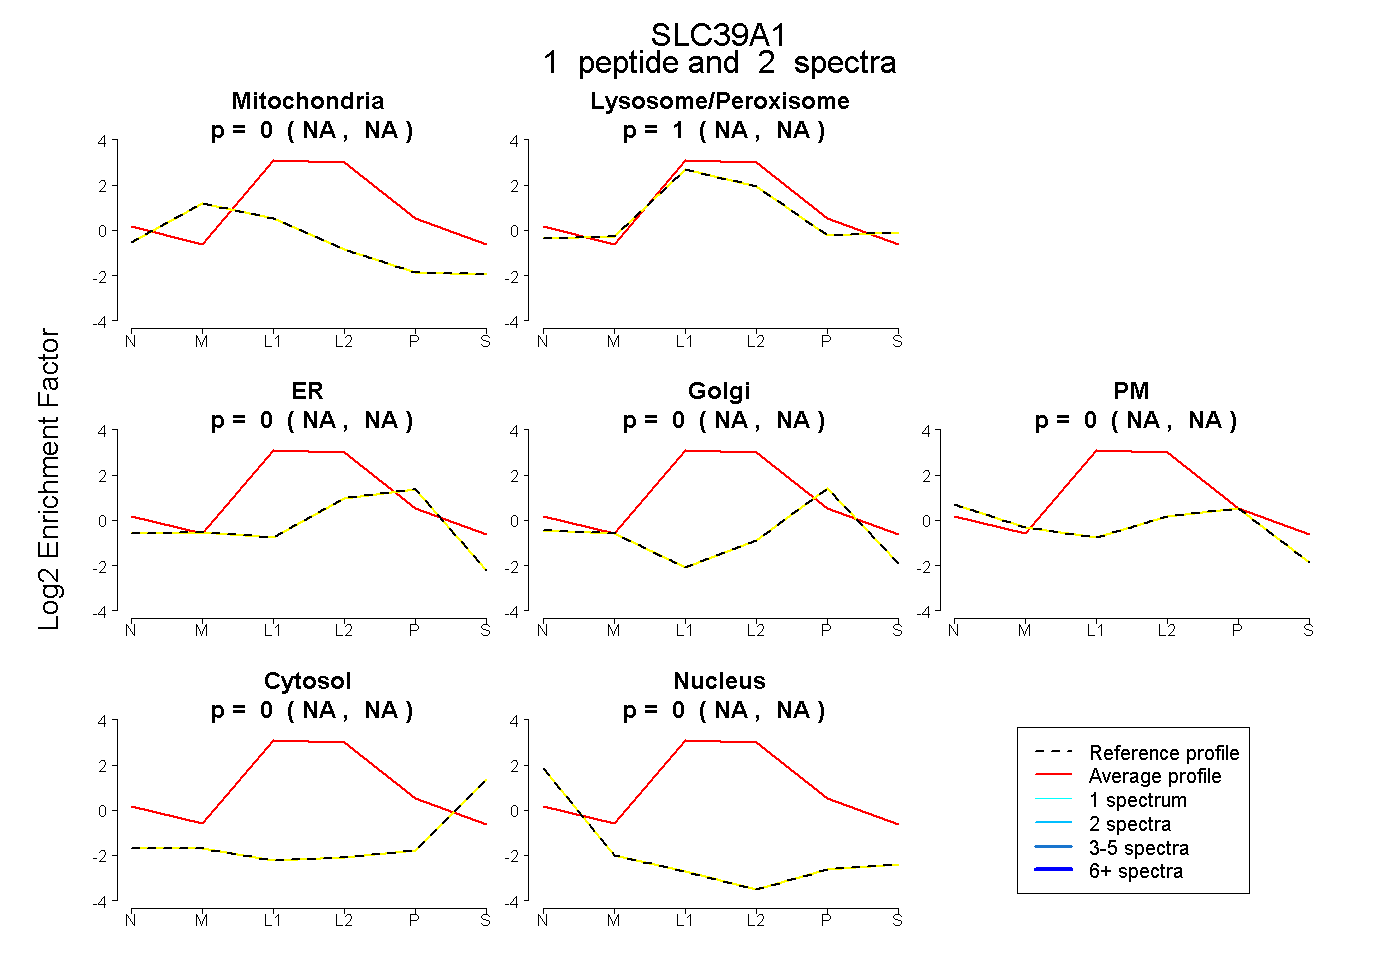
NA | NA
NA | NA
NA | NA
NA | NA
NA | NA
NA | NA
NA | NA
3peptides
spectra
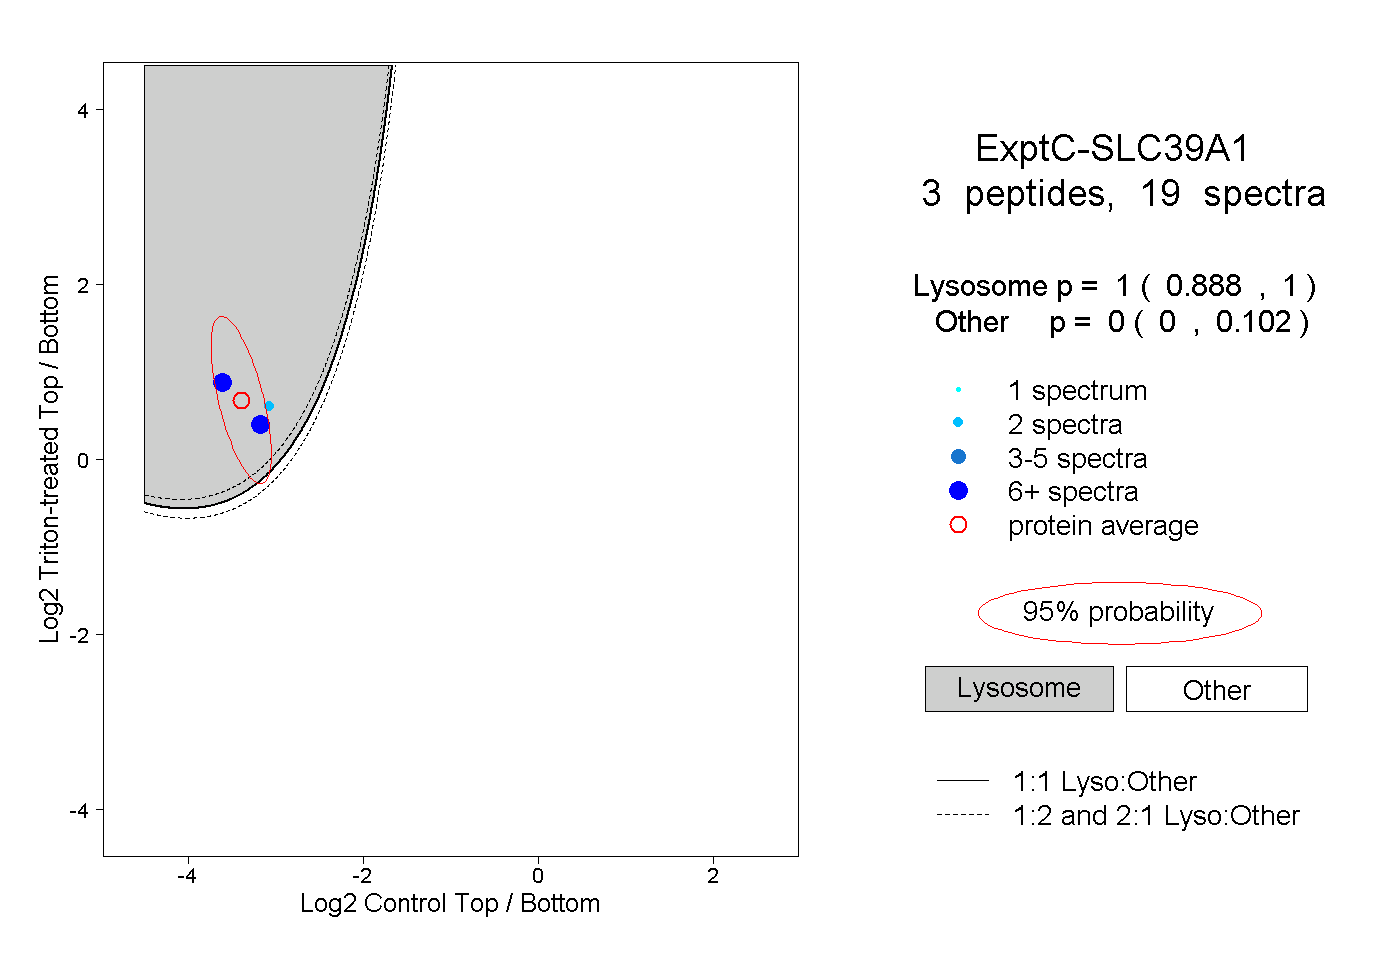
0.888 | 1.000
0.000 | 0.102
2peptides
spectra
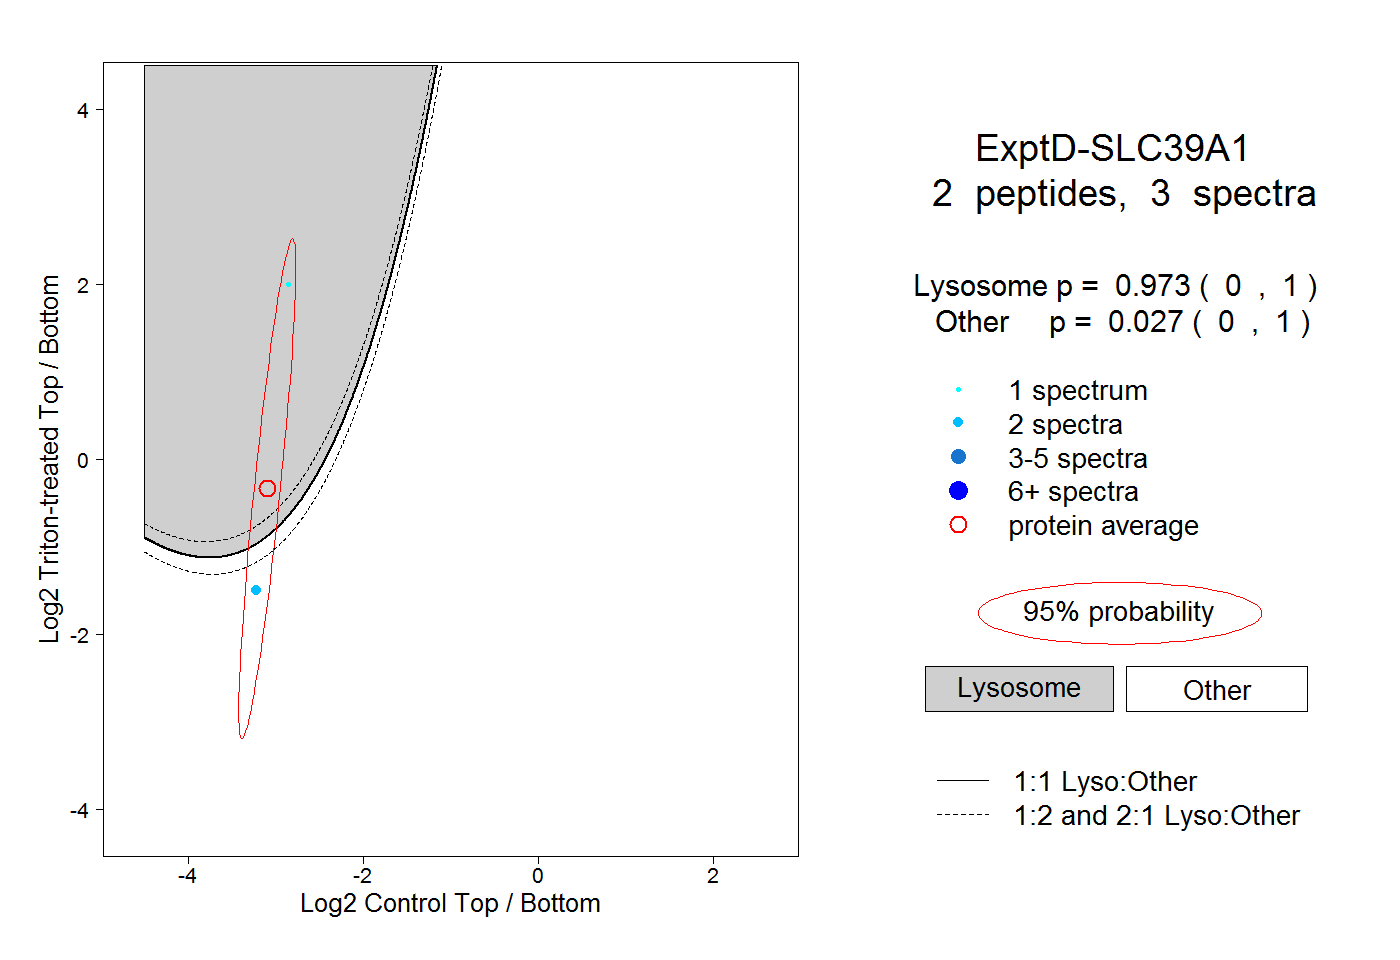
0.000 | 1.000
0.000 | 1.000