 4
4peptides
spectra
0.884 | 0.916
0.000 | 0.000
0.000 | 0.000
0.000 | 0.000
0.000 | 0.000
0.000 | 0.000
0.000 | 0.000
0.080 | 0.113
| Plot | Mito | Lyso | Perox | ER | Golgi | PM | Cytosol | Nucleus | |||||
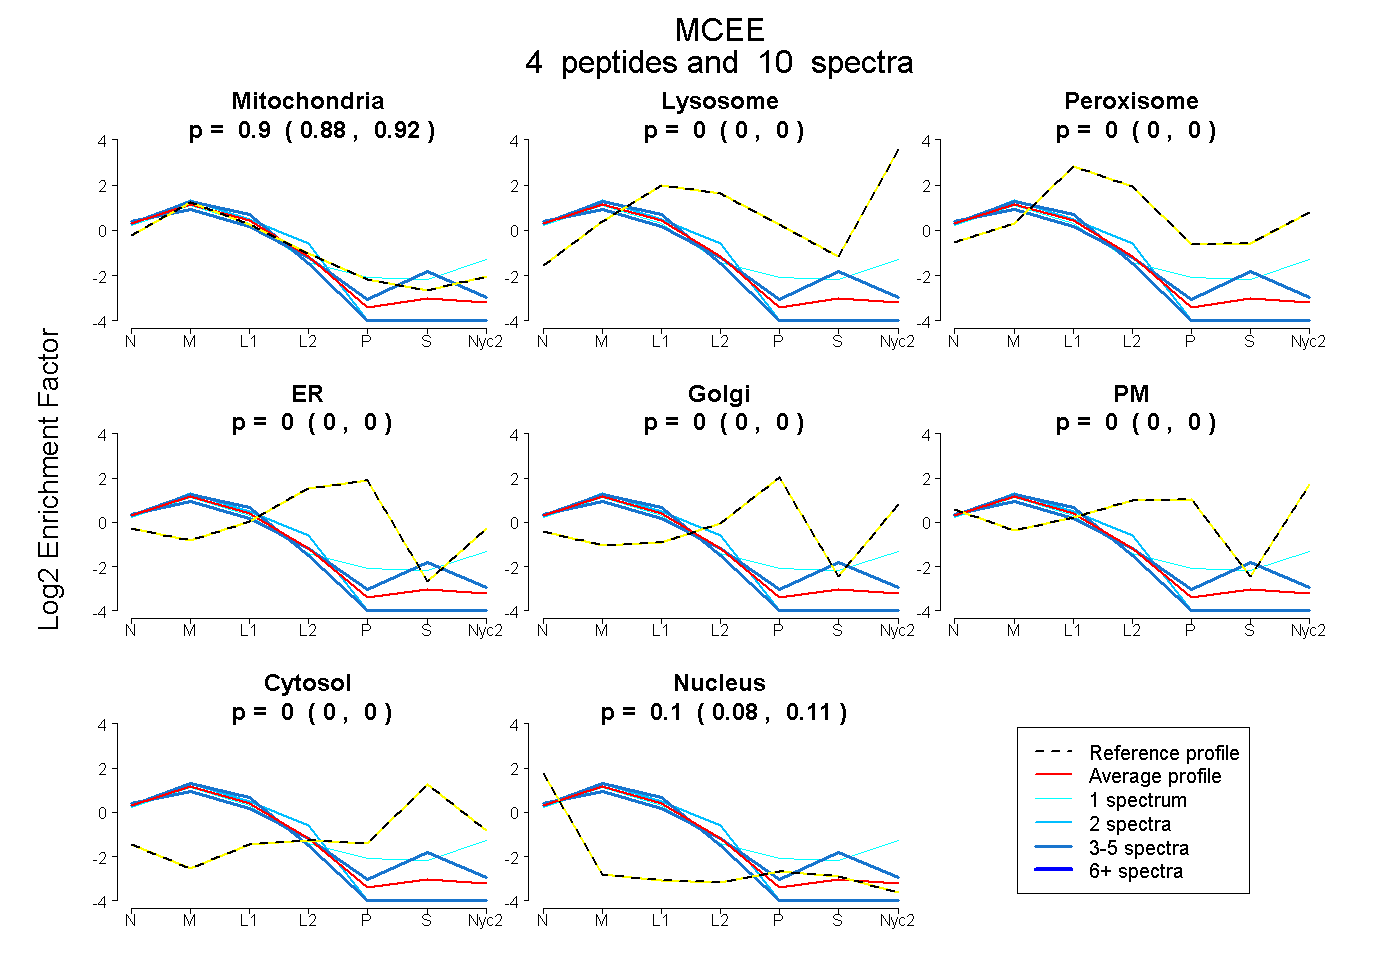
| Expt A |
4 peptides |
10 spectra |
|
0.903 0.884 | 0.916 |
0.000 0.000 | 0.000 |
0.000 0.000 | 0.000 |
0.000 0.000 | 0.000 |
0.000 0.000 | 0.000 |
0.000 0.000 | 0.000 |
0.000 0.000 | 0.000 |
0.097 0.080 | 0.113 |
| 4 spectra, SLSDEAK | 0.874 | 0.000 | 0.000 | 0.000 | 0.000 | 0.000 | 0.006 | 0.121 | ||
| 1 spectrum, ASSFYR | 0.822 | 0.101 | 0.000 | 0.000 | 0.000 | 0.000 | 0.001 | 0.076 | ||
| 2 spectra, LNHVAIAVPDLEK | 0.914 | 0.000 | 0.000 | 0.000 | 0.000 | 0.000 | 0.000 | 0.086 | ||
| 3 spectra, MELLHPLGSDSPIAGFLQK | 0.876 | 0.000 | 0.000 | 0.000 | 0.000 | 0.000 | 0.000 | 0.124 |
| Plot | Mito | Lyso or Perox | ER | Golgi | PM | Cytosol | Nucleus | ||||||
| Expt B |
2 peptides |
4 spectra |
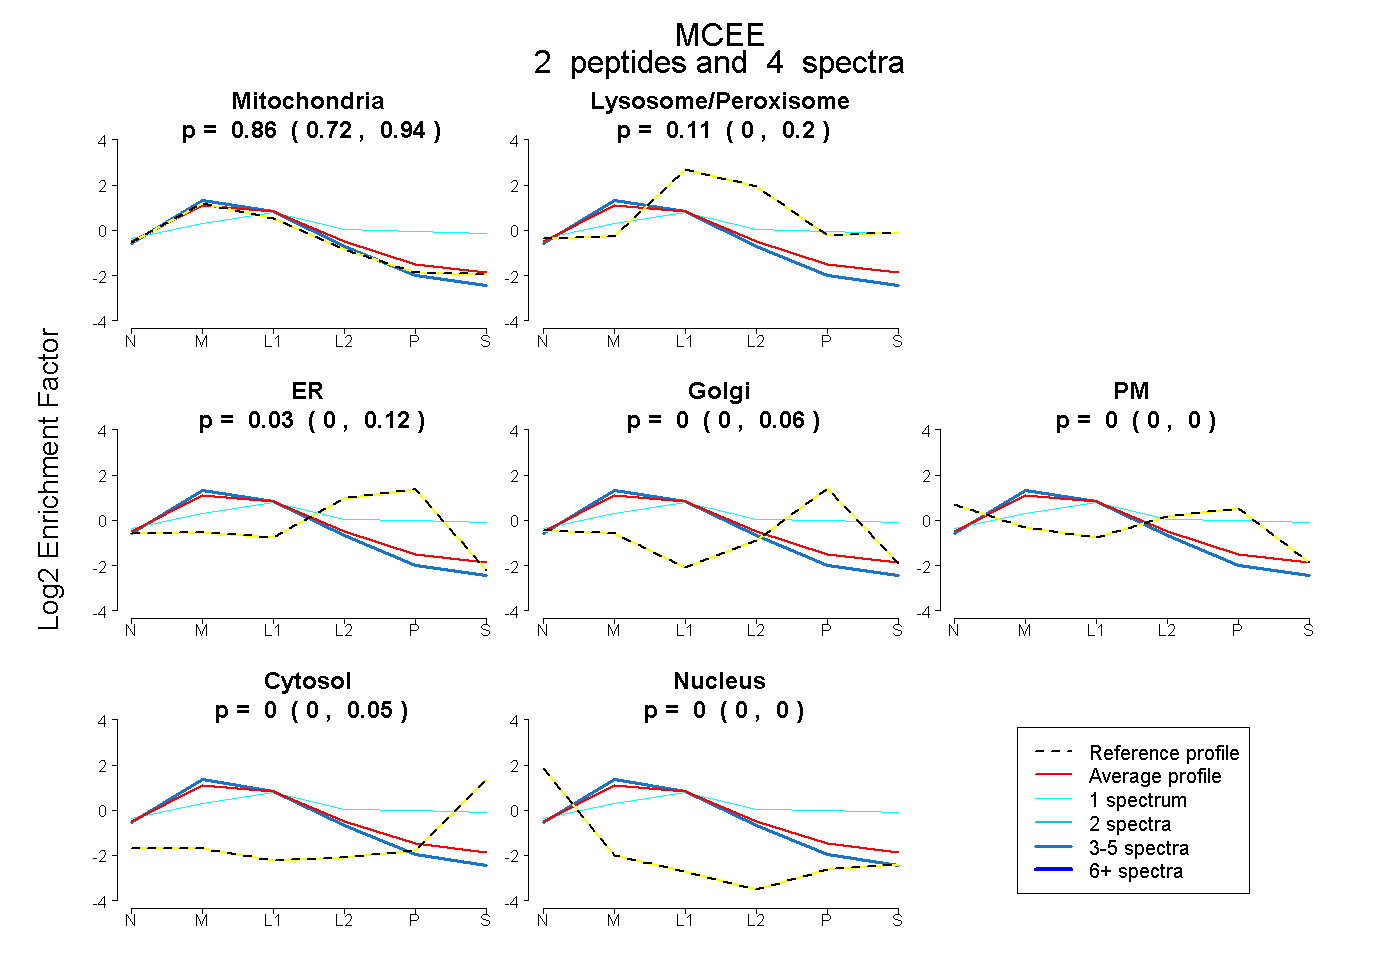 |
0.863 0.721 | 0.940 |
0.107 0.000 | 0.197 |
0.031 0.000 | 0.120 |
0.000 0.000 | 0.055 |
0.000 0.000 | 0.000 |
0.000 0.000 | 0.049 |
0.000 0.000 | 0.002 |
|||
| Plot | Lyso | Other | |||||||||||
| Expt C |
4 peptides |
62 spectra |
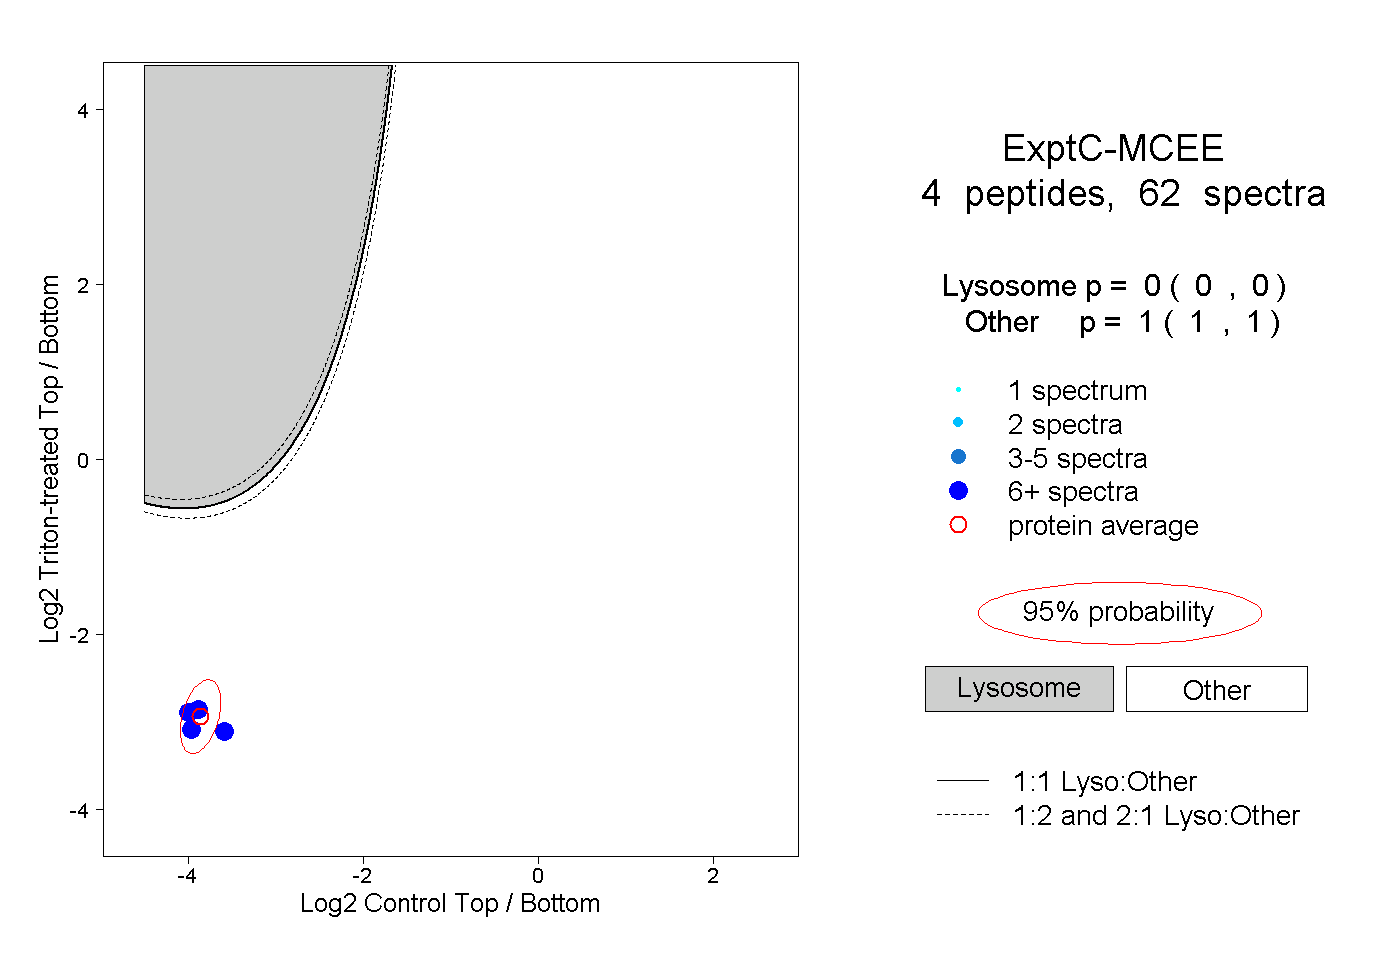 |
0.000 0.000 | 0.000 |
1.000 1.000 | 1.000 |
||||||||
| Plot | Lyso | Other | |||||||||||
| Expt D |
2 peptides |
2 spectra |
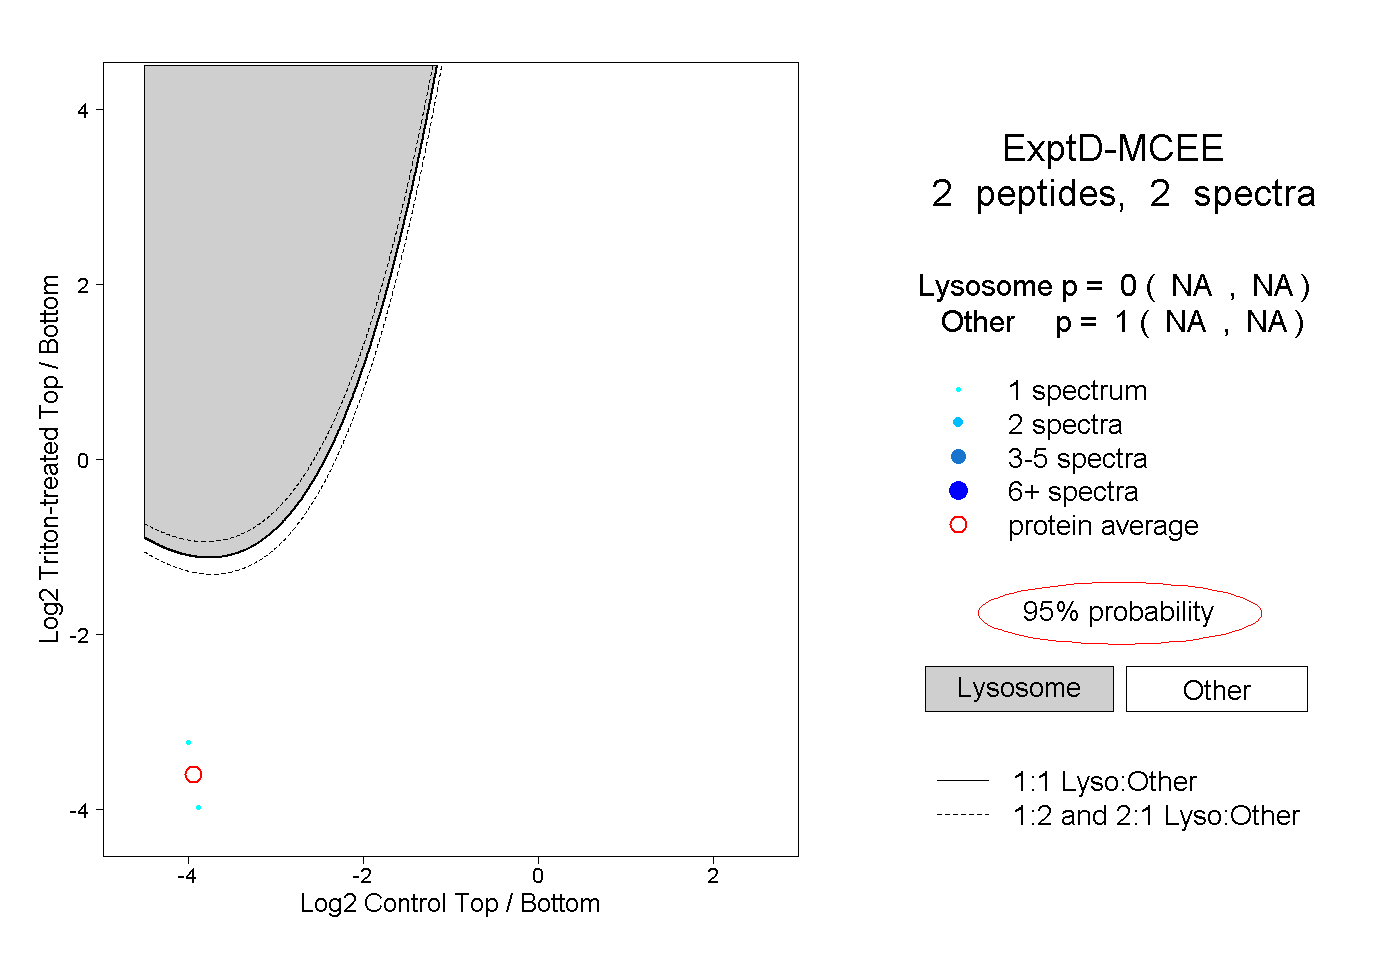 |
0.000 NA | NA |
1.000 NA | NA |