 3
3peptides
spectra
0.000 | 0.000
0.000 | 0.008
0.229 | 0.276
0.330 | 0.409
0.000 | 0.019
0.233 | 0.303
0.074 | 0.110
0.000 | 0.000
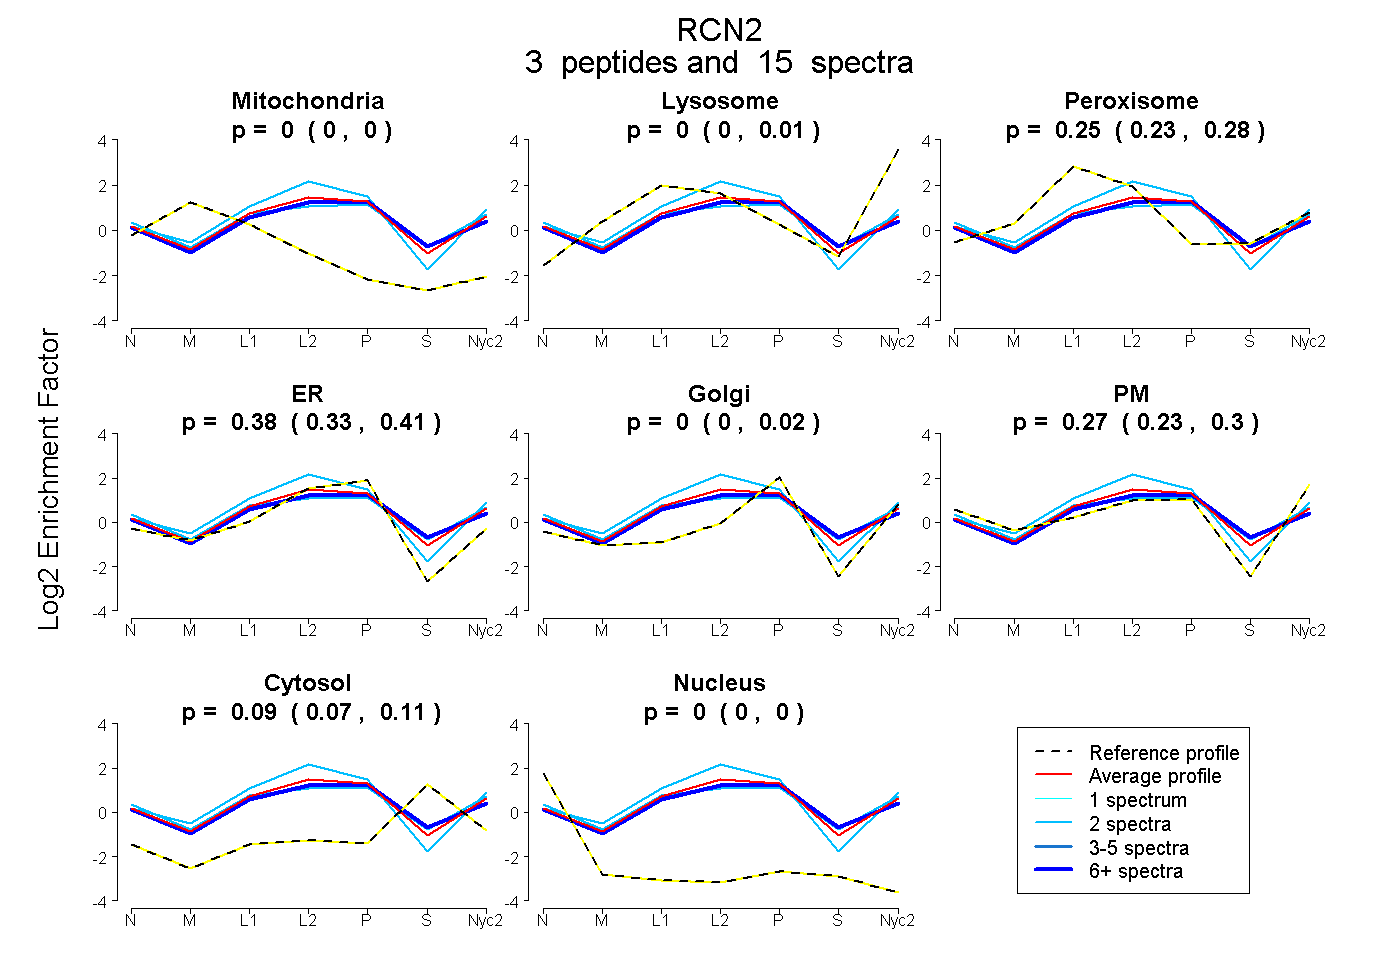
| Plot | Mito | Lyso | Perox | ER | Golgi | PM | Cytosol | Nucleus | |||||
| Expt A |
3 peptides |
15 spectra |
|
0.000 0.000 | 0.000 |
0.000 0.000 | 0.008 |
0.254 0.229 | 0.276 |
0.377 0.330 | 0.409 |
0.000 0.000 | 0.019 |
0.274 0.233 | 0.303 |
0.094 0.074 | 0.110 |
0.000 0.000 | 0.000 |
| 2 spectra, LQSLIK | 0.000 | 0.082 | 0.233 | 0.470 | 0.000 | 0.215 | 0.000 | 0.000 | ||
| 11 spectra, QLHDDYFYHDEL | 0.000 | 0.000 | 0.231 | 0.388 | 0.002 | 0.214 | 0.165 | 0.000 | ||
| 2 spectra, HYAMQEAK | 0.000 | 0.000 | 0.265 | 0.203 | 0.033 | 0.361 | 0.138 | 0.000 |
| Plot | Lyso | Other | |||||||||||
| Expt C |
5 peptides |
10 spectra |
 |
0.000 0.000 | 0.000 |
1.000 1.000 | 1.000 |