 3
3peptides
spectra

0.000 | 0.000
0.000 | 0.000
0.000 | 0.000
0.000 | 0.000
0.211 | 0.229
0.000 | 0.000
0.740 | 0.760
0.018 | 0.037
| Plot | Mito | Lyso | Perox | ER | Golgi | PM | Cytosol | Nucleus | |||||
| Expt A |
3 peptides |
9 spectra |
|
0.000 0.000 | 0.000 |
0.000 0.000 | 0.000 |
0.000 0.000 | 0.000 |
0.000 0.000 | 0.000 |
0.221 0.211 | 0.229 |
0.000 0.000 | 0.000 |
0.751 0.740 | 0.760 |
0.028 0.018 | 0.037 |
| 2 spectra, SPEQTSPR | 0.000 | 0.000 | 0.000 | 0.000 | 0.250 | 0.000 | 0.719 | 0.031 | ||
| 2 spectra, VGFITPVSSR | 0.000 | 0.000 | 0.000 | 0.000 | 0.198 | 0.000 | 0.763 | 0.038 | ||
| 5 spectra, AFFAVLAPAR | 0.000 | 0.000 | 0.000 | 0.000 | 0.213 | 0.000 | 0.771 | 0.016 |
| Plot | Mito | Lyso or Perox | ER | Golgi | PM | Cytosol | Nucleus | ||||||
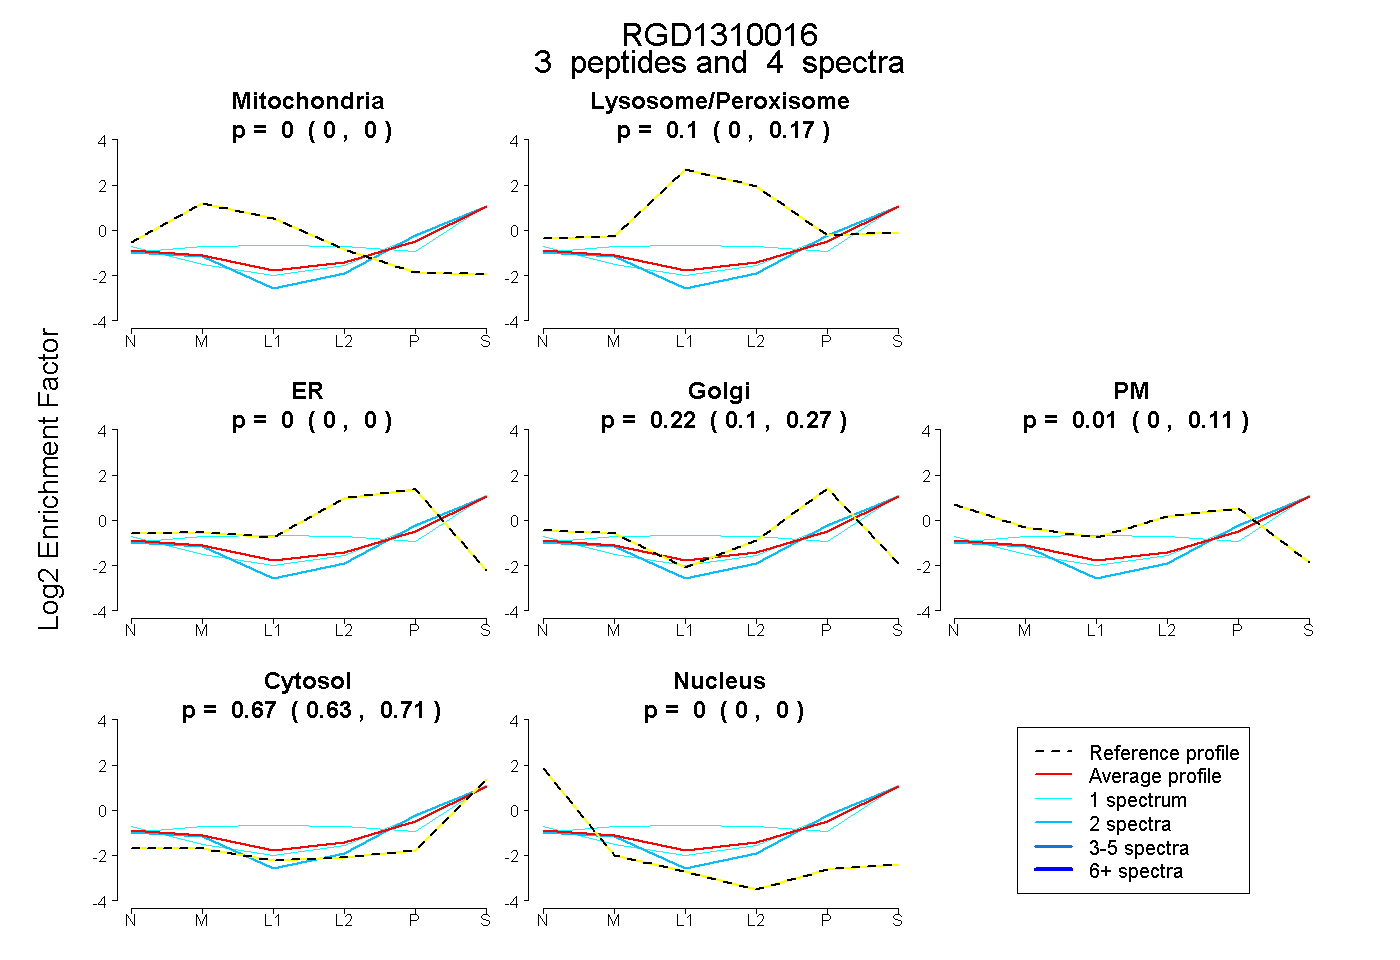
| Expt B |
3 peptides |
4 spectra |
 |
0.000 0.000 | 0.000 |
0.104 0.001 | 0.172 |
0.000 0.000 | 0.000 |
0.217 0.104 | 0.265 |
0.008 0.000 | 0.108 |
0.670 0.625 | 0.714 |
0.000 0.000 | 0.000 |
|||
| Plot | Lyso | Other | |||||||||||
| Expt C |
2 peptides |
3 spectra |
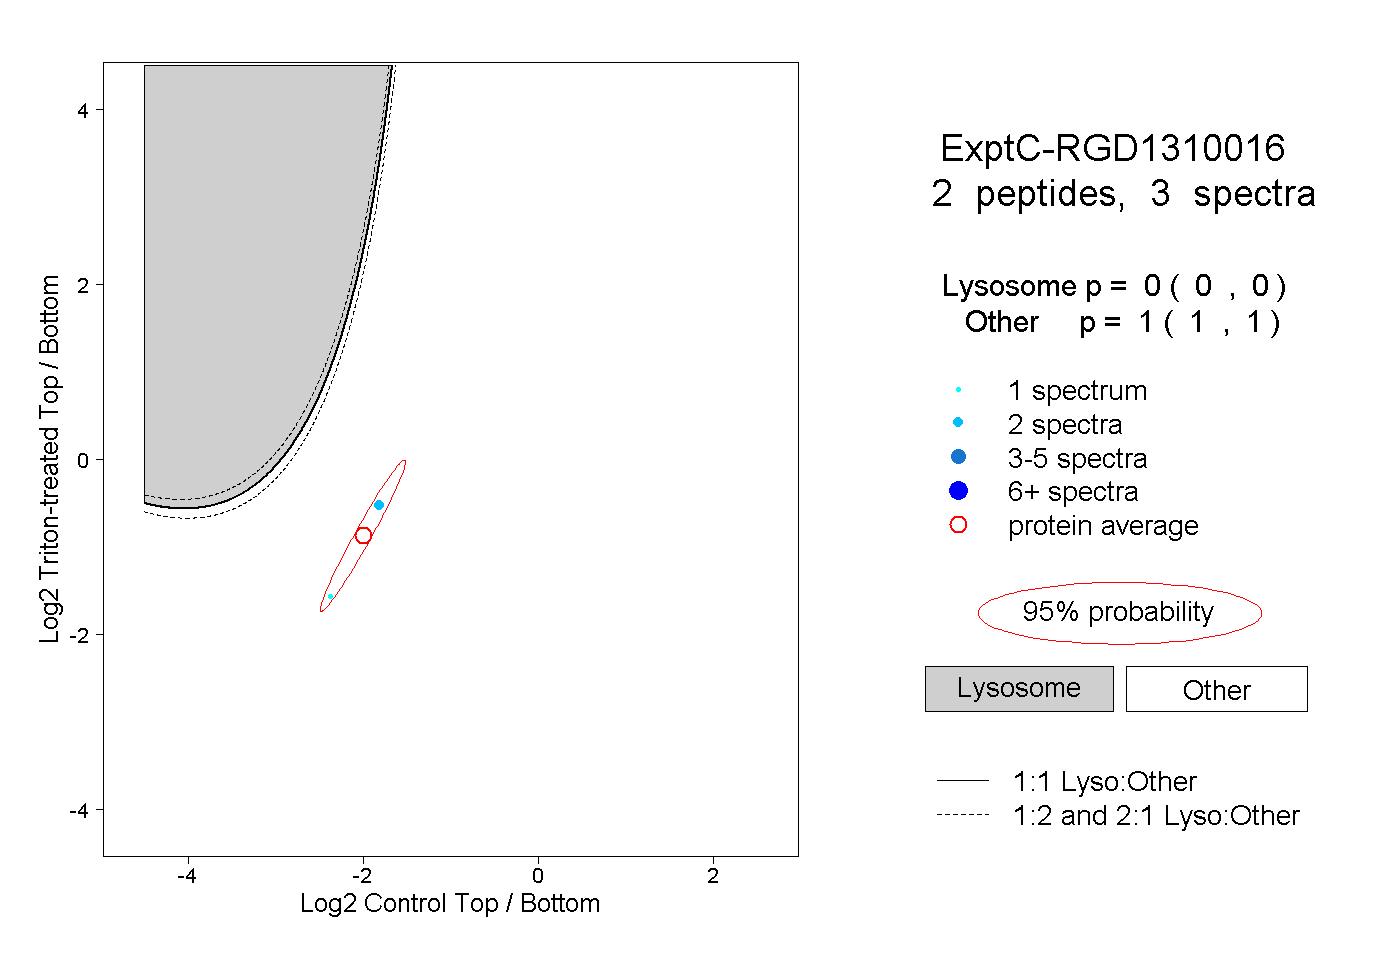 |
0.000 0.000 | 0.000 |
1.000 1.000 | 1.000 |