 3
3peptides
spectra
0.000 | 0.092
0.078 | 0.365
0.000 | 0.178
0.388 | 0.672
0.000 | 0.000
0.000 | 0.277
0.000 | 0.000
0.000 | 0.000
| Plot | Mito | Lyso | Perox | ER | Golgi | PM | Cytosol | Nucleus | |||||
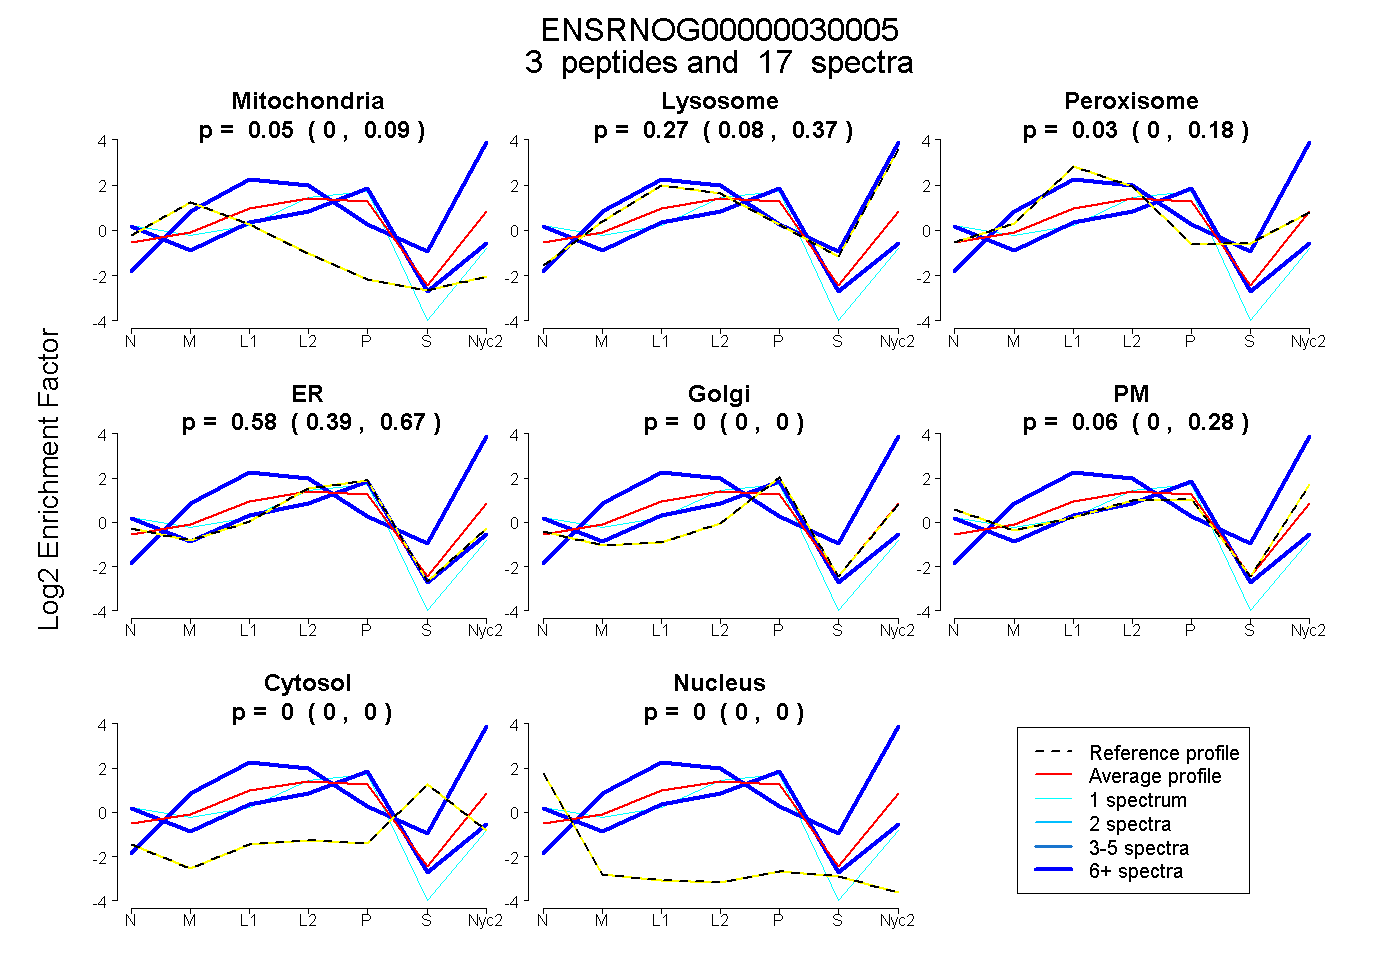
| Expt A |
3 peptides |
17 spectra |
|
0.048 0.000 | 0.092 |
0.274 0.078 | 0.365 |
0.034 0.000 | 0.178 |
0.582 0.388 | 0.672 |
0.000 0.000 | 0.000 |
0.062 0.000 | 0.277 |
0.000 0.000 | 0.000 |
0.000 0.000 | 0.000 |
| 10 spectra, SLVHPK | 0.020 | 0.000 | 0.004 | 0.883 | 0.011 | 0.025 | 0.000 | 0.056 | ||
| 6 spectra, IMSSPR | 0.000 | 1.000 | 0.000 | 0.000 | 0.000 | 0.000 | 0.000 | 0.000 | ||
| 1 spectrum, FINFVPTNLLHAVTCDIK | 0.105 | 0.000 | 0.000 | 0.895 | 0.000 | 0.000 | 0.000 | 0.000 |
| Plot | Mito | Lyso or Perox | ER | Golgi | PM | Cytosol | Nucleus | ||||||
| Expt B |
1 peptide |
2 spectra |
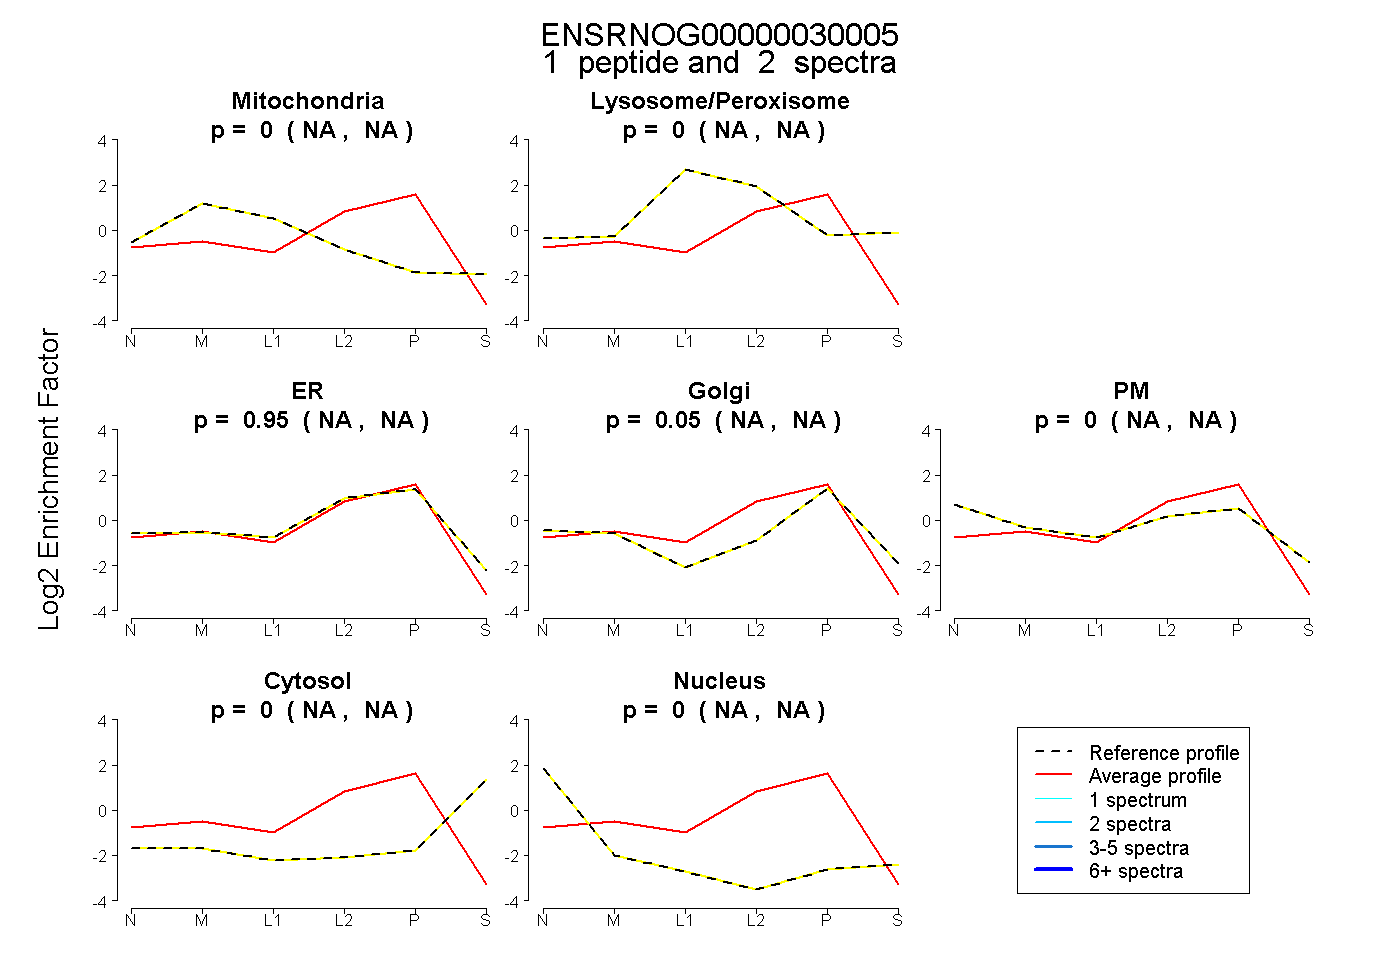 |
0.000 NA | NA |
0.000 NA | NA |
0.953 NA | NA |
0.047 NA | NA |
0.000 NA | NA |
0.000 NA | NA |
0.000 NA | NA |
|||
| Plot | Lyso | Other | |||||||||||
| Expt C |
3 peptides |
12 spectra |
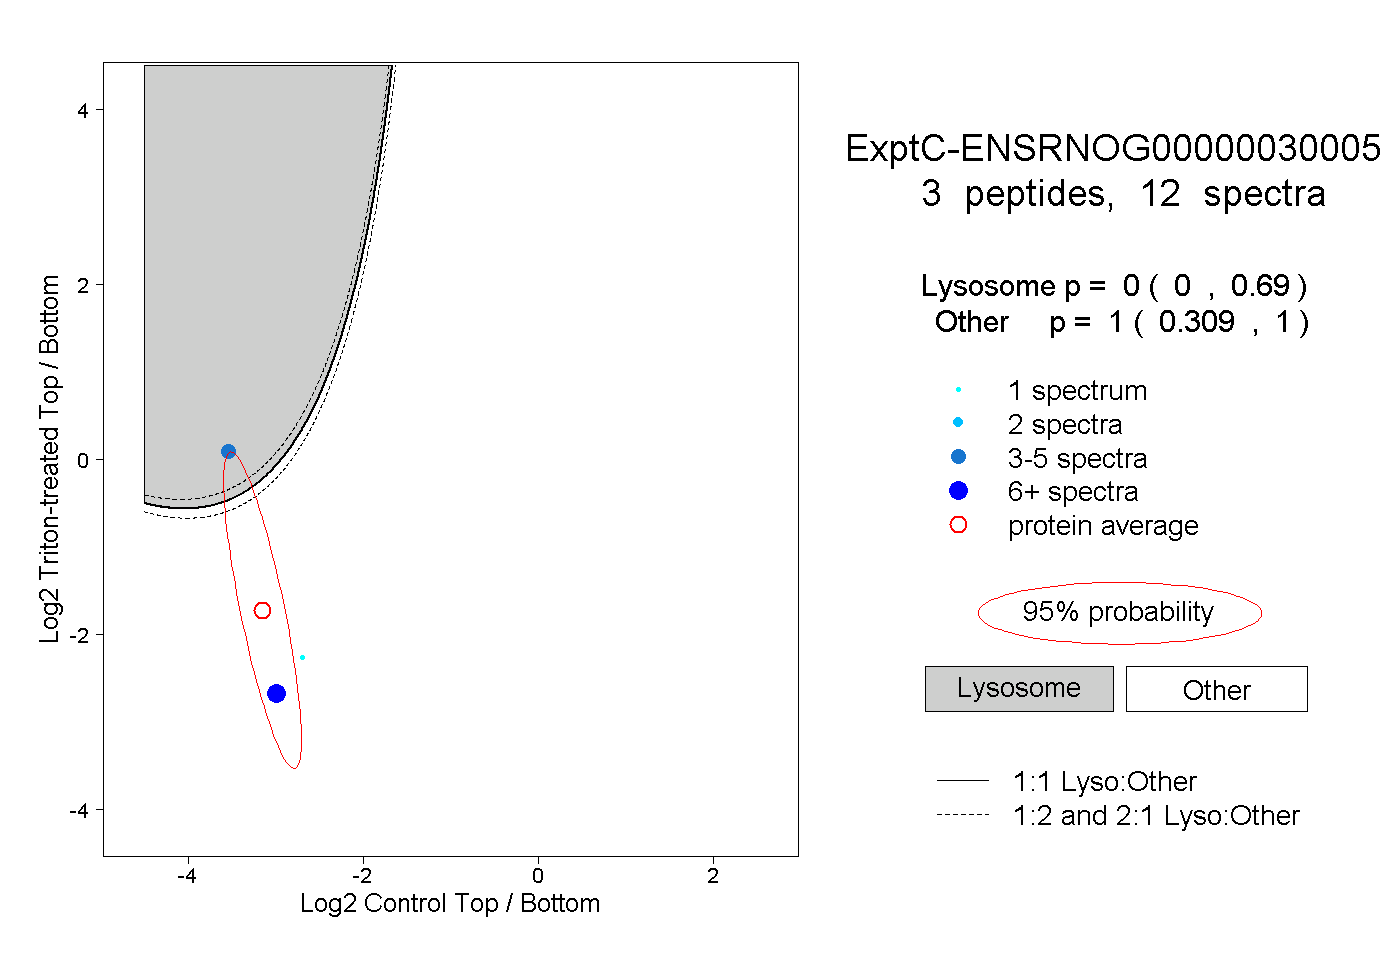 |
0.000 0.000 | 0.690 |
1.000 0.309 | 1.000 |