 6
6peptides
spectra
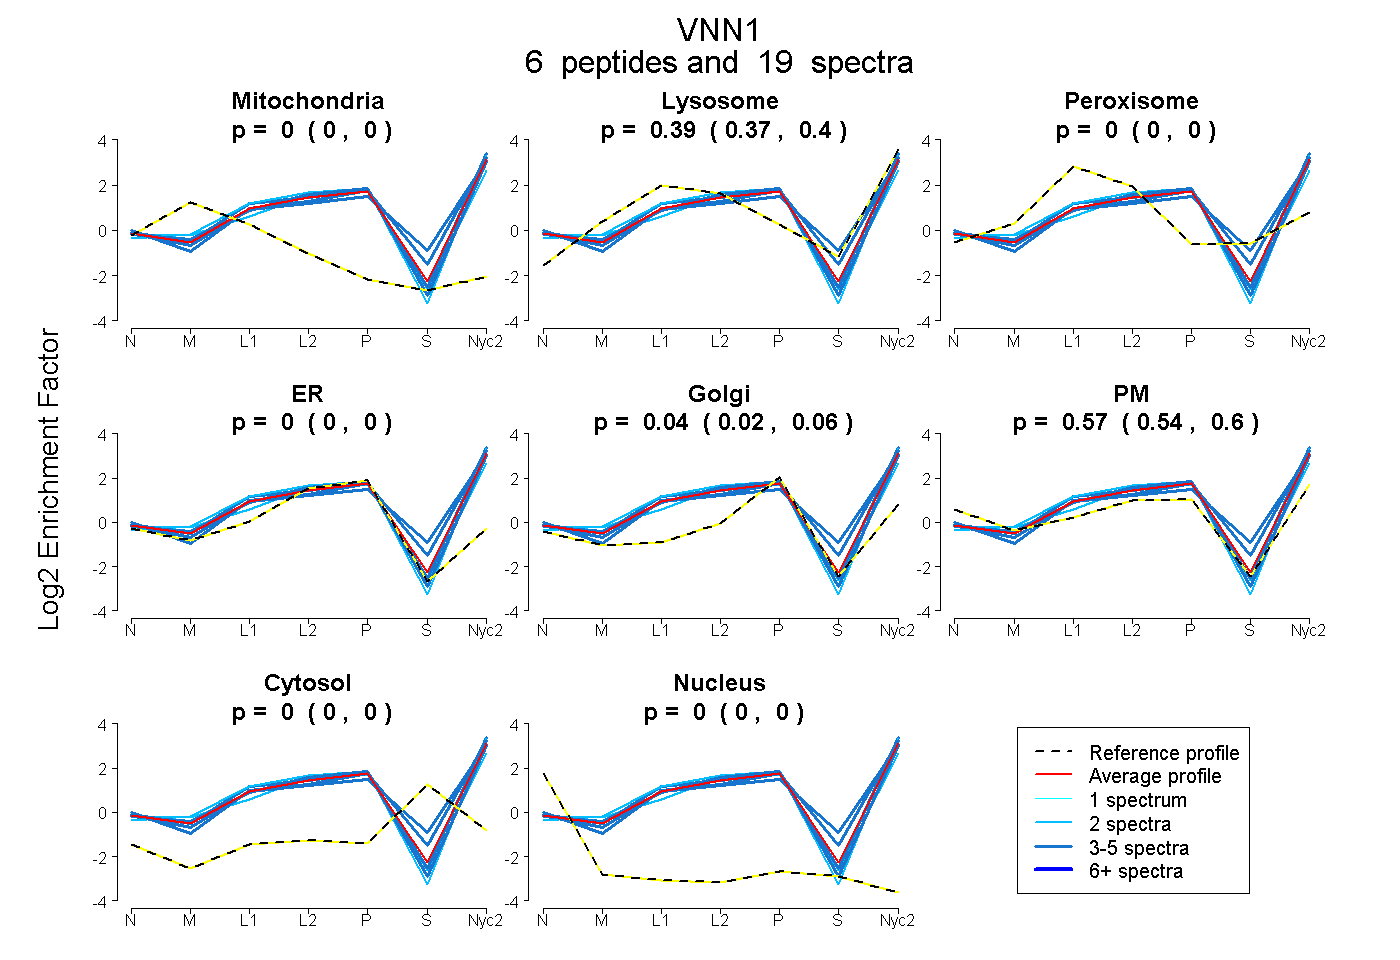
0.000 | 0.000
0.366 | 0.402
0.000 | 0.000
0.000 | 0.000
0.024 | 0.057
0.539 | 0.600
0.000 | 0.000
0.000 | 0.000
1peptide
spectra
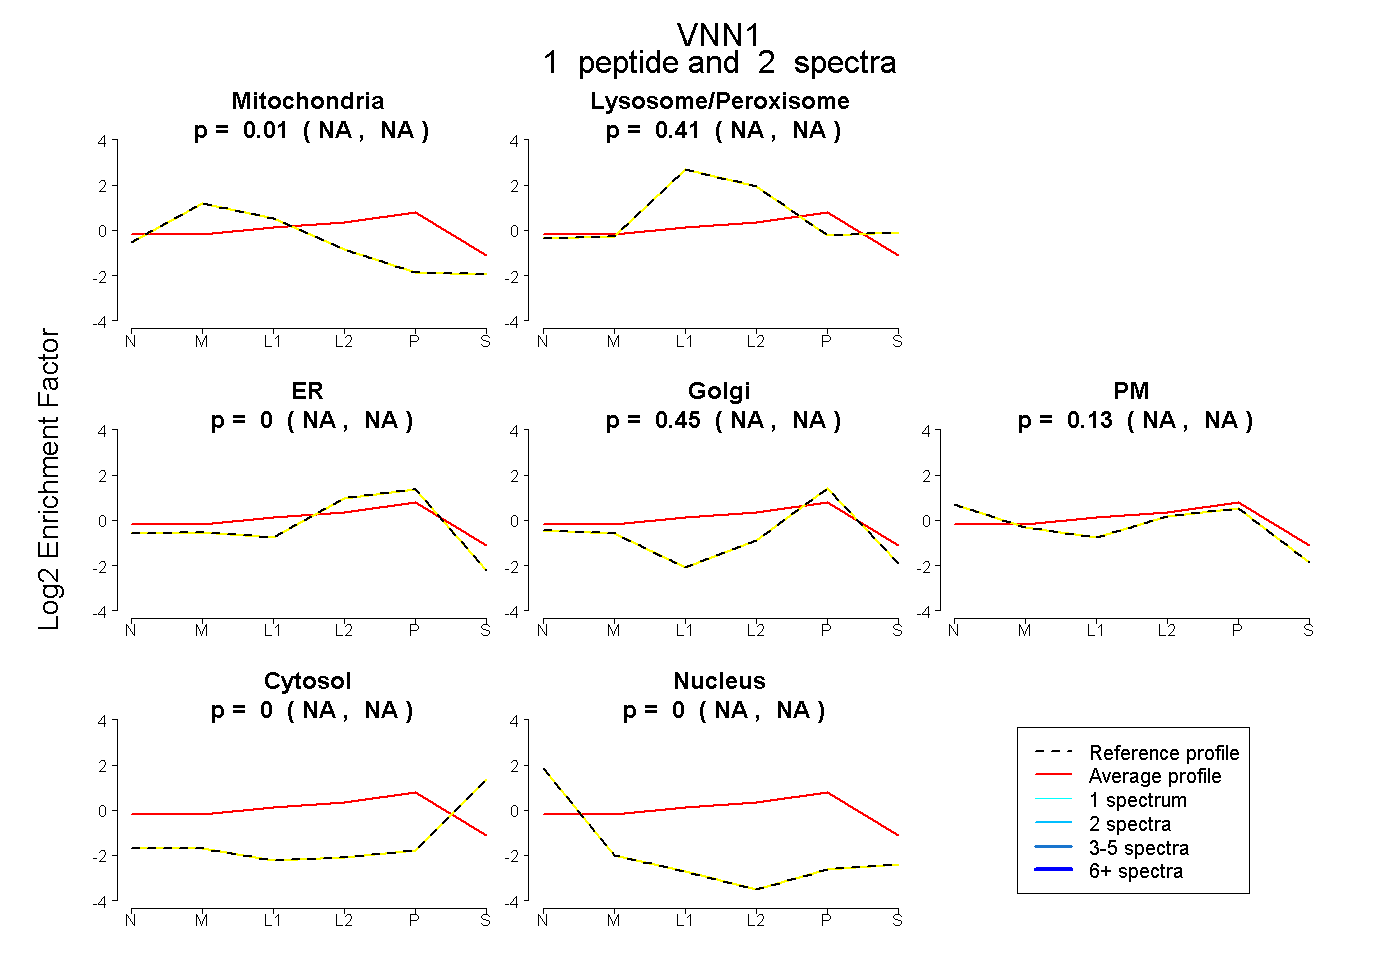
NA | NA
NA | NA
NA | NA
NA | NA
NA | NA
NA | NA
NA | NA
8peptides
spectra
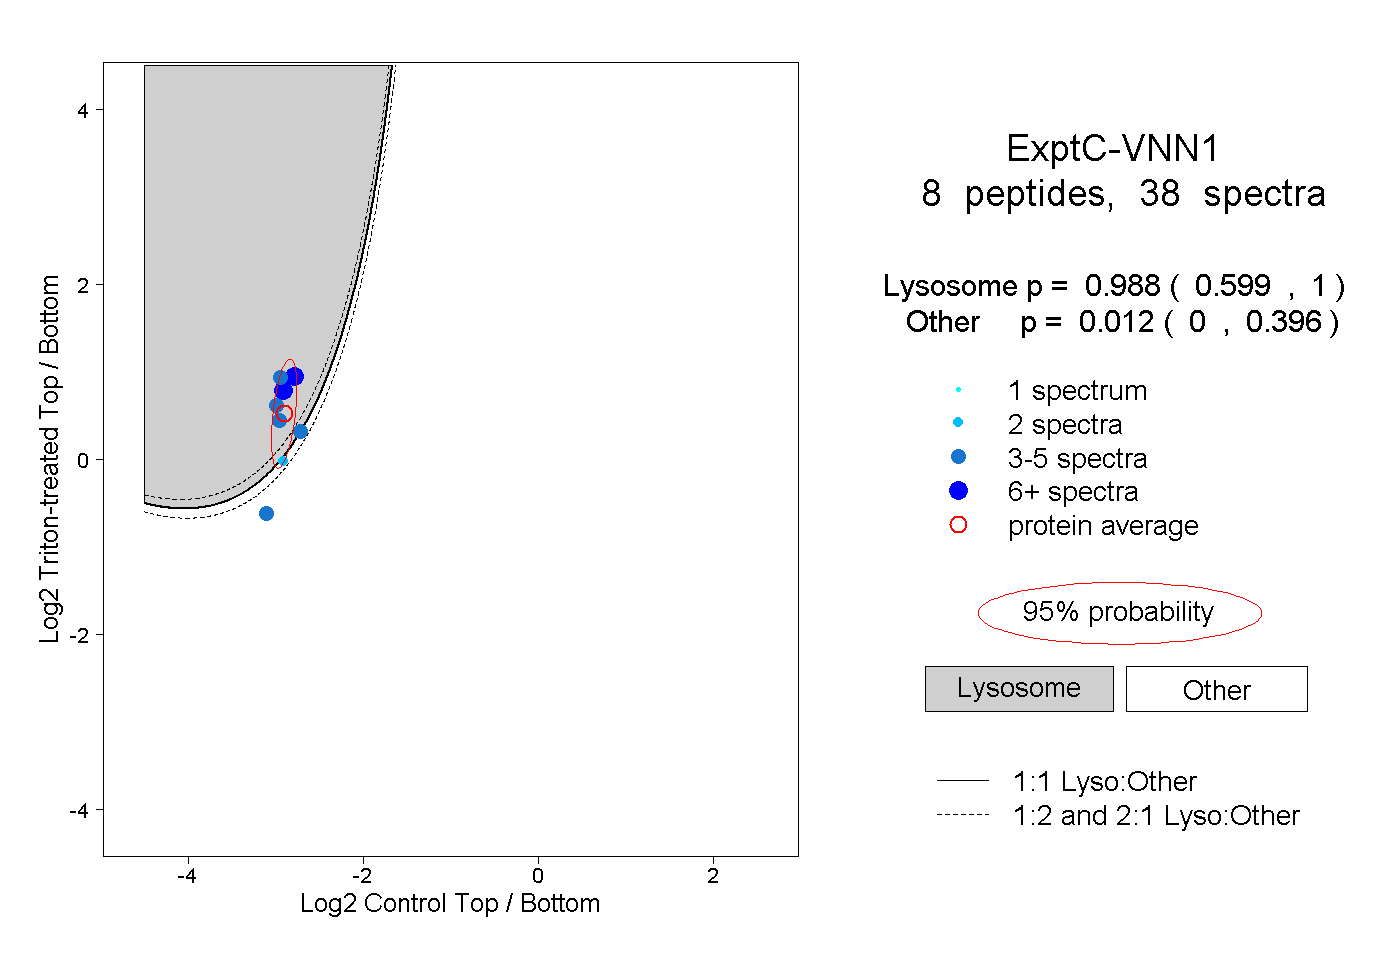
0.599 | 1.000
0.000 | 0.396
2peptides
spectra
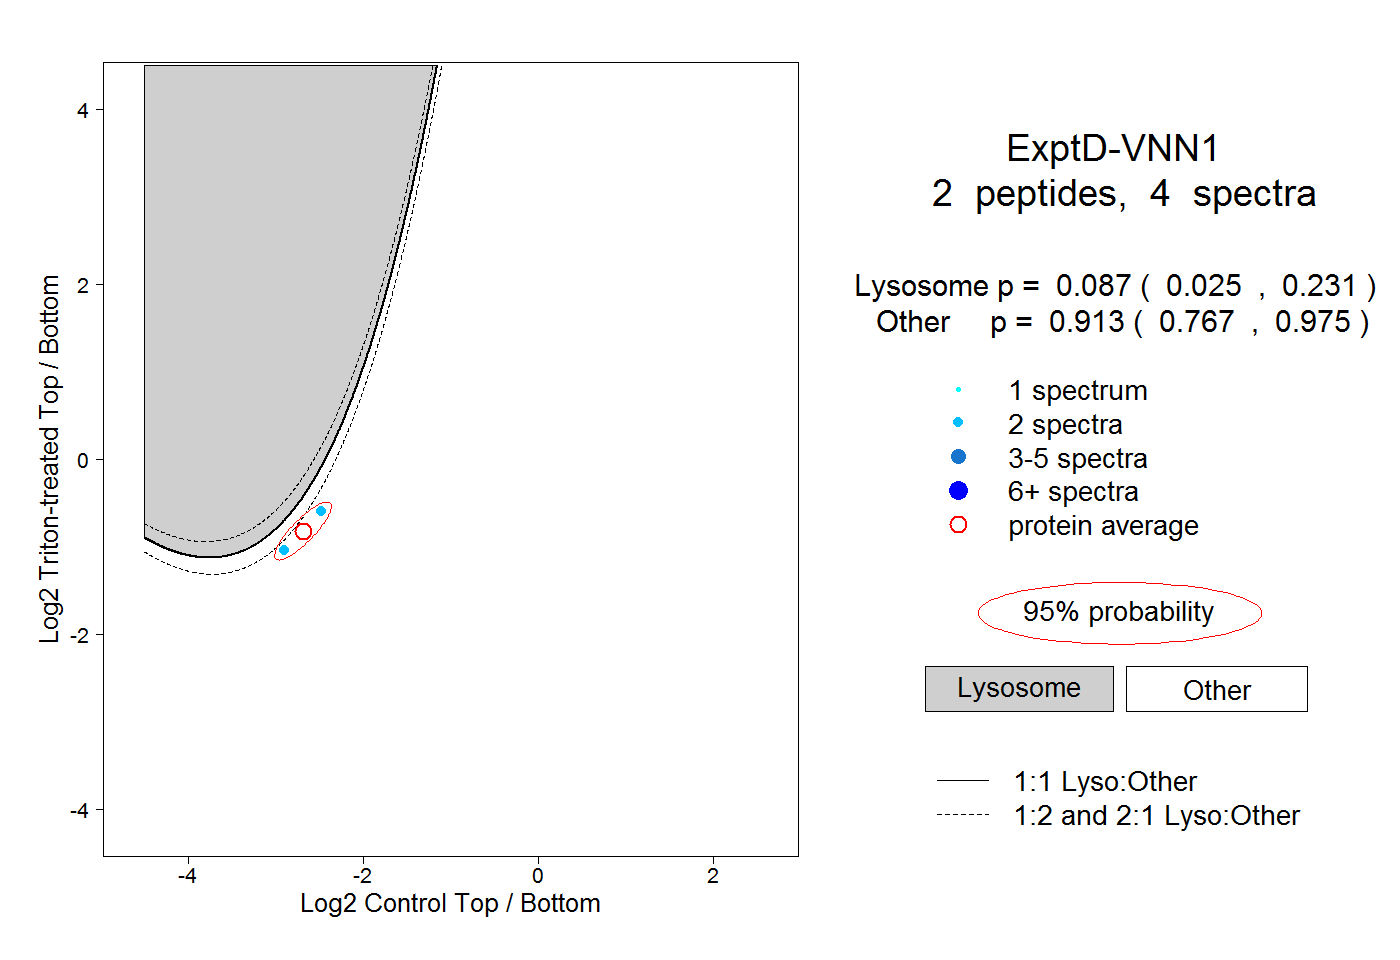
0.025 | 0.231
0.767 | 0.975